
Earth-clock upgrade — Earth, Air, Wind and Fire

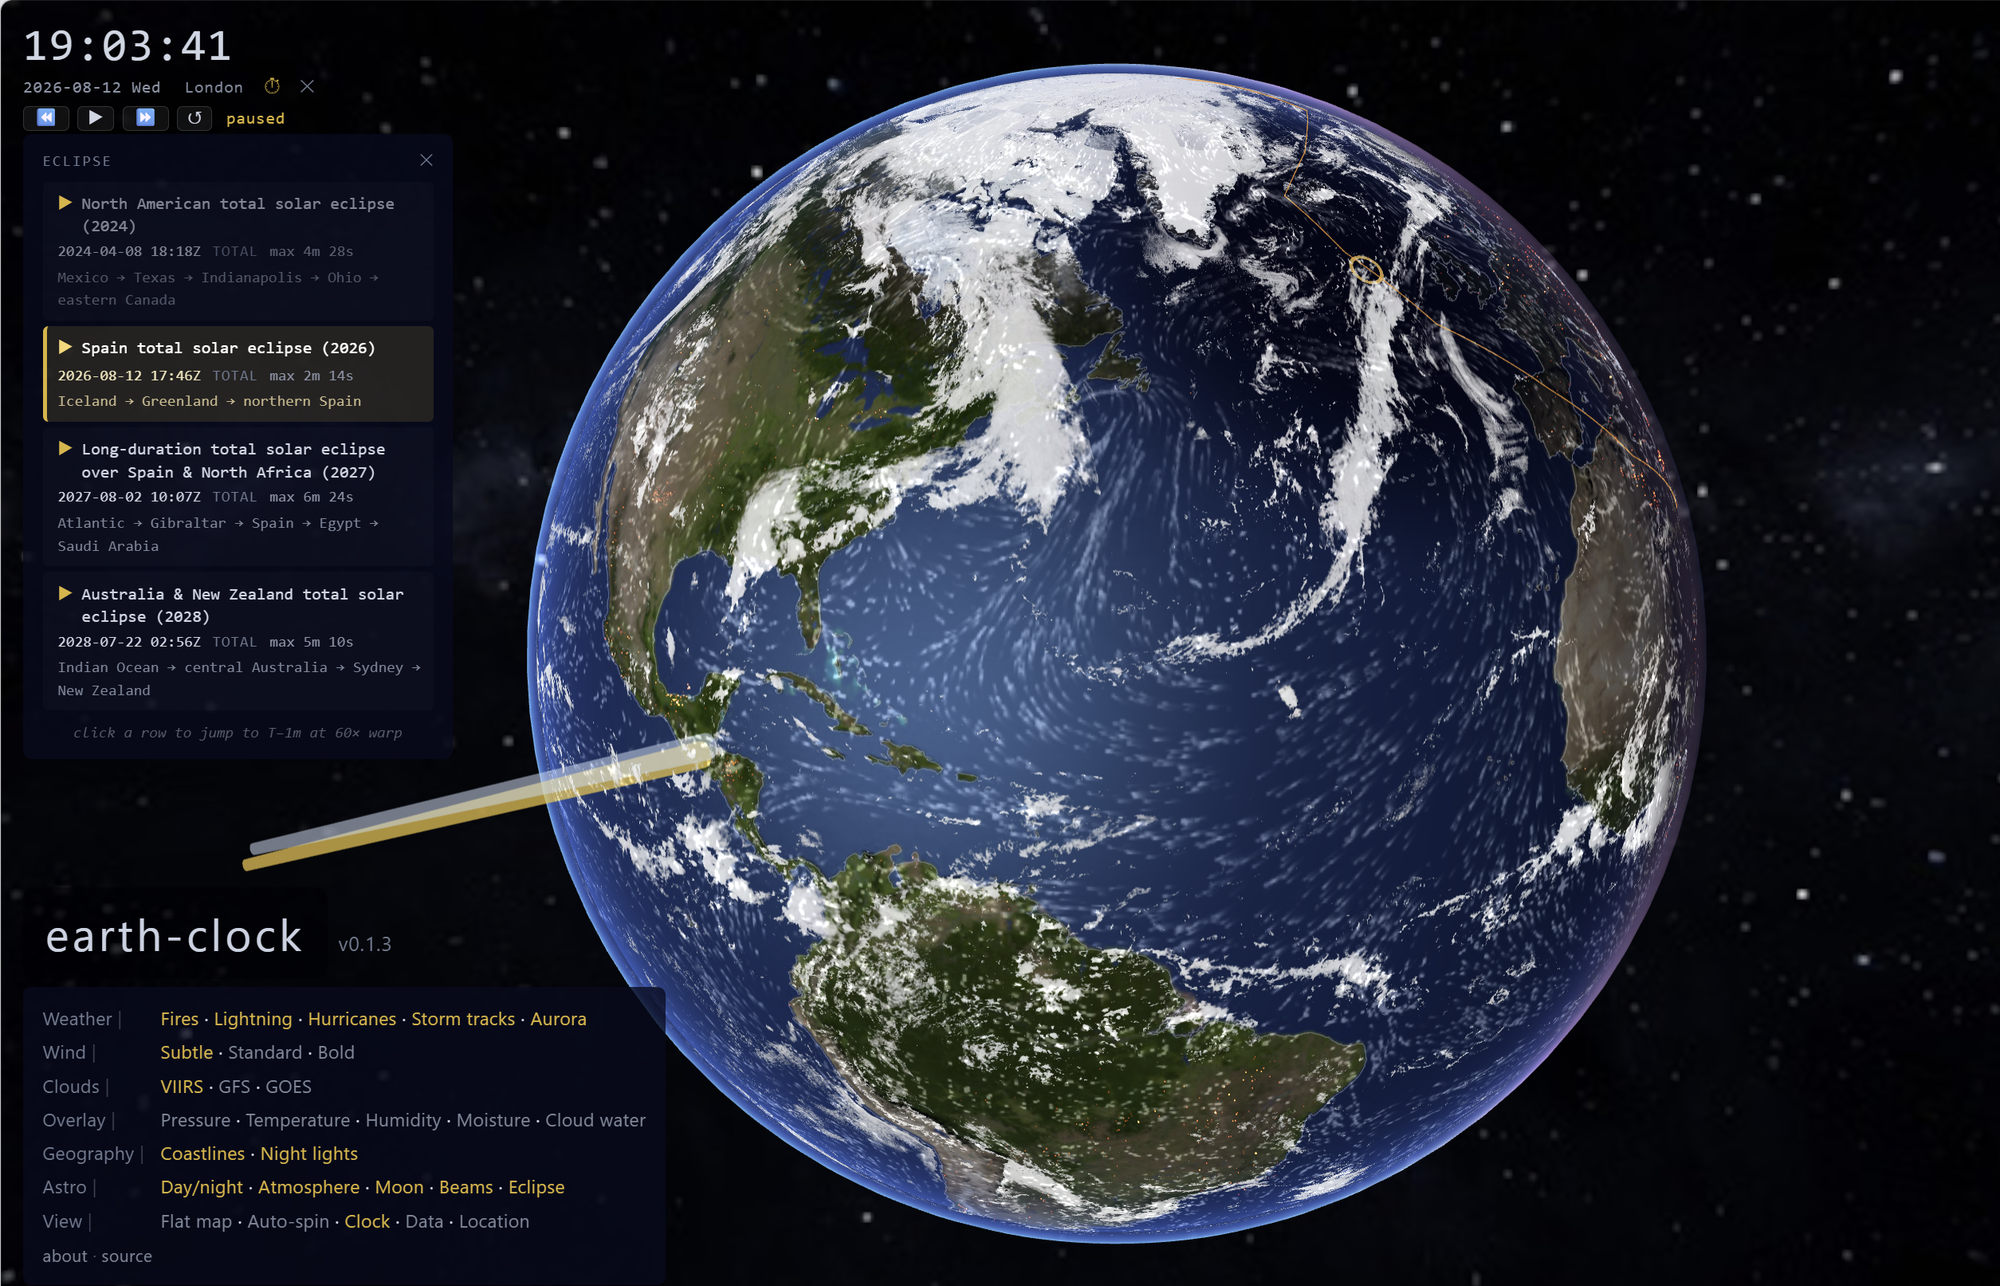
A while back I wrote about Eclipses, equinoxes, and everyday awe — telling the time on Spaceship Earth. That post argued why a real-time planet visualization should exist as something you leave running: a clock told by the planet's orientation in space, a daily reminder that we're crew on a small rotating vessel hurtling through a vast and largely empty universe.
The first version of earth-clock, in late 2025, was a small thing: a fork of Cameron Beccario's earth.nullschool.net — the animated-wind globe that's been the reference for live planetary visualisation for over a decade — with a real-time day/night terminator added on top, so the Earth visibly turned past the sun.
This post is about the full 2026 rebuild, which goes considerably further. New engine top to bottom: WebGL instead of D3 canvas, GPU wind particles, a physically-lit globe, the moon at its true distance, a real star sky, half a dozen live weather feeds, and a NASA-data-driven solar-eclipse renderer targeting the 2026-08-12 total eclipse over Spain. The site is at https://earth-clock.onemonkey.org/; the source is https://github.com/infantlab/earth-clock , freely licenced under MIT.
The current version has a lot more to offer than before. At any given moment we give you:
- Earth — a physically-lit, axially-tilted sphere with day-side surface texture, night-side city lights, and real coastlines.
- Air — yesterday's true-colour cloud composite from NASA satellites, with an atmospheric rim glow.
- Wind — 65,536 GPU-simulated particles drifting across the planet under the real GFS surface-wind field, refreshed every six hours.
- Fire — active wildfires from the last 24 hours of NASA satellite thermal detections, sized and coloured by intensity.
Plus the auroras, the hurricanes, the lightning strikes, the moon at its true distance, the sun's actual position in the sky, the catalogued solar eclipses with NASA's published centerlines, and a real star map behind it all. Everything updates live. Time-warp moves the sun, moon, eclipse shadows, and Earth's rotation together.
A clock made of sunbeams
The original philosophical post argued that the clock isn't on the wall — it is the Earth's orientation in space. Earth-clock makes that literal with a feature called Beams. Switch it on (Astro row, "Beams") and two thin tapered cylinders appear, sticking out of the planet:
- A gold beam pointing at the sun. Its base sits on Earth's surface exactly where the sun is directly overhead at this instant — the sub-solar point — and the beam extends outward toward the sun's true position in the sky.
- A silver beam pointing at the moon, identical in construction. Its base sits on the sub-lunar point.
These are gnomons. The word means one who knows in Greek; it's what sundial-makers call the central post whose shadow tells you the hour. Earth-clock's beams are gnomons in the same sense, only inverted: they don't cast a shadow because they are the sun's and moon's true direction, drawn directly. The shadow they would have cast is just the night side of Earth.
What they do is make the clock-ness of the planet impossible to miss. If the gold beam is to your east, you are before noon, if it to your west, it's afternoon for you.
Run the simulated clock at 1×, and the beams sit almost still. Spin time-warp up to 1440× (a day per minute), and the gold beam sweeps a full rotation around the equator every second — Earth visibly rotating past the static sun. Push to 86,400× (a day per second), and you can watch the gold beam's latitude swing back and forth between the Tropics of Cancer and Capricorn as the seasons cycle.
The silver moon beam moves on its own slower rhythm. It drifts around the planet roughly 13% more slowly than the gold one — the difference between Earth's spin and the moon's orbital motion, which is why moonrise is later each night by ~50 minutes. On the equirectangular flat map the same two markers become a gold dot at the sub-solar point and a phase-aware silver disc at the sub-lunar point, illuminated according to the current moon phase. (The terminator on the moon disc is computed live from the geometry of where the sun, Earth, and moon actually are right now — there's no painted-on shadow.)
Once you have these two beams visible at all times, an eclipse stops being an abstract event you read about and becomes something obvious. A solar eclipse is the moment when the gold and silver beams point in the same direction. The moon comes between Earth and the sun; its silver beam aligns almost perfectly with the gold one; the moon's shadow falls on Earth's surface; people in that shadow see the sun blacked out for a few minutes. The geometry is just three balls in a line, and the beams are the line.
Which leads us, naturally, to:
The 2026 Spain eclipse
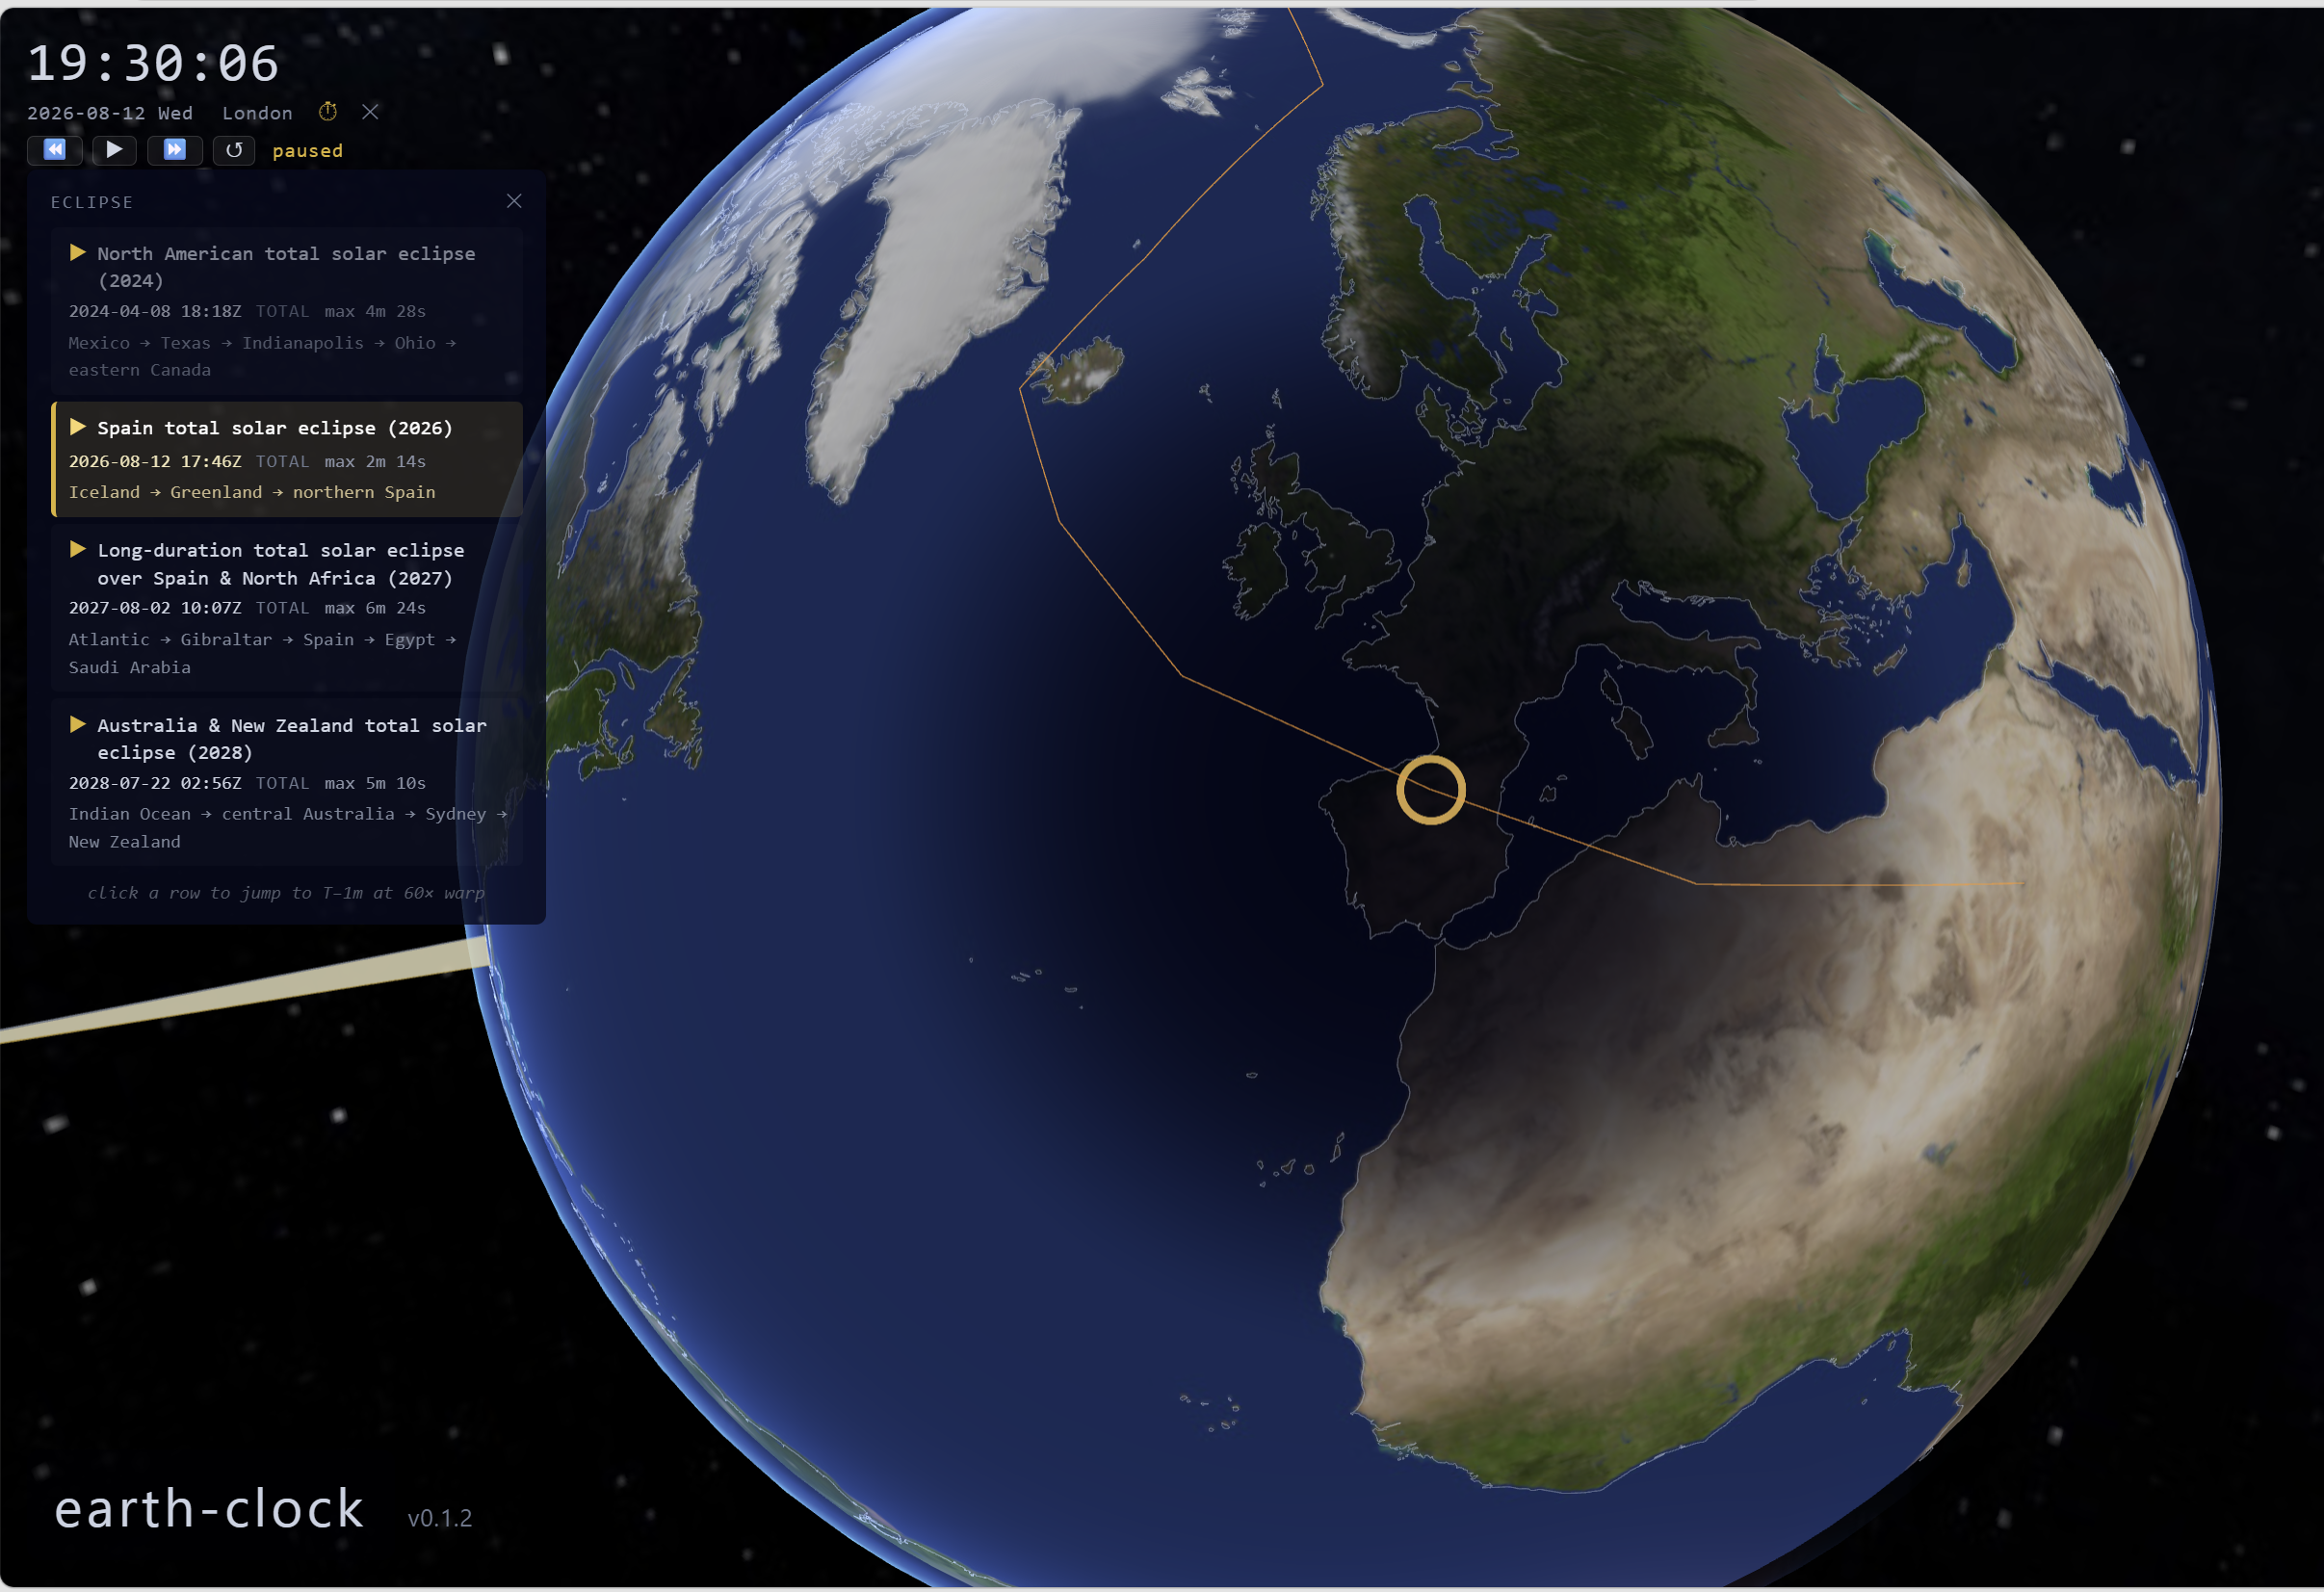
On 2026 August 12, the moon's umbra will cross northern Spain. Bilbao, Valladolid, and Mallorca will see roughly two minutes of totality each. It's the first total solar eclipse over mainland Spain since 1905, and the headline event this rebuild was paced around.
Open the Eclipse panel (Astro row in the menu), click "Spain total solar eclipse (2026)", and a few things happen:
- The simulated clock snaps to T-minus-one-minute of the eclipse window.
- Time-warp goes to 60×, so the four-hour event plays out in about four minutes.
- The 3D globe gets a smooth orange path of totality drawn over the surface — Iceland → Greenland → North Atlantic → northern Spain → western Mediterranean.
- A dark umbra disc slides along the path at the correct moment, with a thin warm-gold ring at its boundary — the "diamond ring" instant when one bead of sunlight breaks past the lunar limb just before totality begins.
The catalogue currently includes four events: the 2024-04-08 North American eclipse (historical, kept so you can revisit it), the 2026-08-12 Spain headline, the 2027-08-02 long-duration Spain/Egypt eclipse (Luxor sees over six minutes — the longest in the Atlantic basin this century), and the 2028-07-22 Australia/New Zealand eclipse (Sydney sees totality at its very centre).
Why we use NASA's data rather than computing the path live
Eclipse geometry is brutally sensitive. The moon's umbra is ~290 km wide where it falls on Earth — a thin pencil dragged across the planet over four hours. Our runtime lunar-position model (Paul Schlyter's simplified orbital elements with main perturbation terms) is accurate to about 0.3° angular, which sounds fine until you remember that a 0.3° error at the moon's distance of 60 Earth radii puts the shadow centerline about 30° away from where it should be on Earth's surface. That's a different continent.
So for catalogued eclipses we don't compute the path live. We use NASA Goddard's published centerline directly — a small array of (time, latitude, longitude, magnitude) waypoints from Fred Espenak and Jean Meeus's predictions. The runtime renderer interpolates these into a smooth great-circle path along the surface, and snaps the live umbra disc to the interpolated position at the current simulated time.
Catching moonbugs..
The planets don't move in nice closed-form orbits. They tug on each other gravitationally; the moon perturbs Earth's orbit; Jupiter perturbs everything. Computing where any one of them will be at a given moment is, formally, an N-body numerical-integration problem with no exact equation. You can get arbitrarily close — modern observatory software does — but only with serious compute, careful bookkeeping, and constants calibrated against decades of direct observation.
Real observatories do it the hard way. For everyone else, astronomers have for three centuries published approximate formulae you can run by hand — arcminute accuracy in exchange for not needing a supercomputer. Earth-clock uses one such set, written in the early 1980s by Swedish amateur astronomer Paul Schlyter (still online). A few lines of BASIC, good across 1500–2200 AD, and quietly underpinning a long tail of weather sites and eclipse visualisers ever since.
Approximate formulae are calibrated to a reference moment — an epoch. The modern convention is J2000: noon UTC, 1 January 2000. Schlyter used 00:00 UTC on 31 December 1999 — the very beginning of that day, 36 hours earlier than J2000. Copy his formula but quietly assume J2000, and your day-count starts 1.5 days wrong. The moon's mean anomaly advances ~13° per day, so the error compounds into a constant ~20° offset in the moon's position.
20° is enough to put the moon's shadow on a different continent. On our first test of the 2026 Spain eclipse the umbra missed Spain, then missed Europe, then we realised the moon was so out of position that no eclipse was geometrically possible anywhere on Earth.
One-line fix. Two months in the codebase before the eclipse test exposed it. When you port an astronomical algorithm, check the epoch.
Apollo, but at 60 frames per second
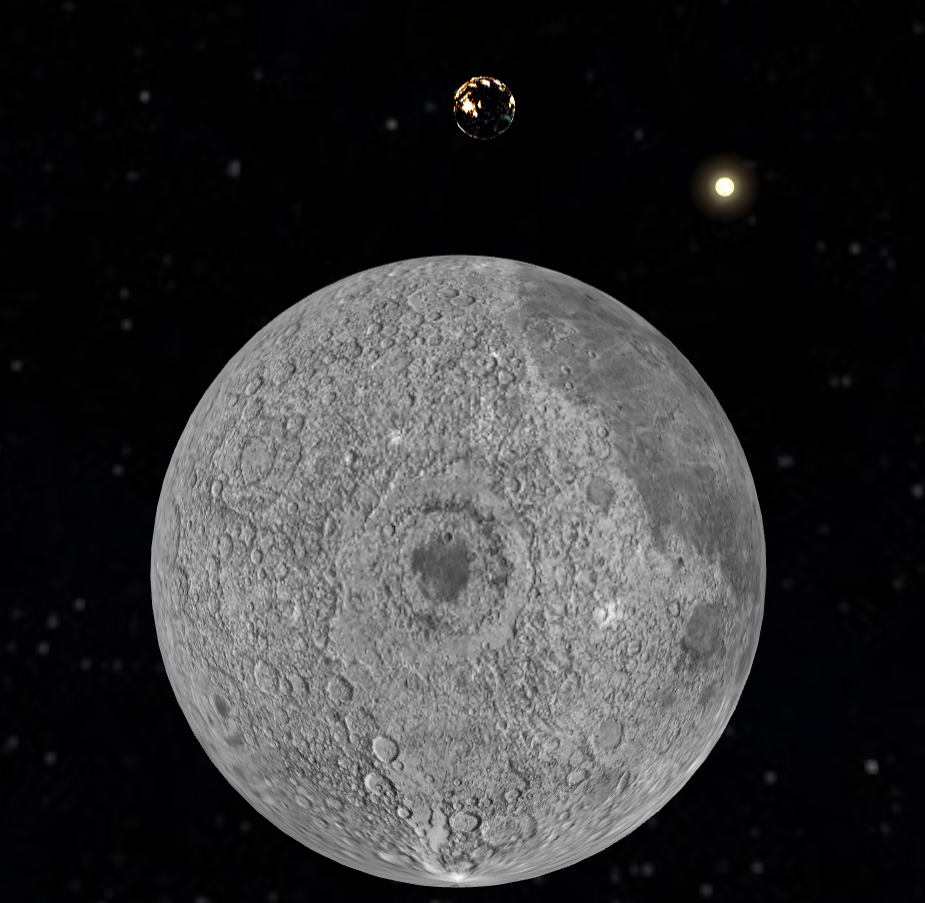
Tap Find moon at the end of the Astro row. The camera flies out along the moon's current direction until both the moon and Earth sit in the same frame — the Apollo 8 Earthrise angle. Christmas Eve 1968, William Anders looked out of a spacecraft window, saw our planet rising over the lunar surface, and grabbed a Hasselblad. The photograph that came out is widely considered the most important ever made.
You can fly there now without leaving the browser. The math underneath — the moon's geocentric position, the sun's true direction, Earth's rotation, the day/night terminator — is the same math NASA was using in 1968 to plan the mission. Computed in a few microseconds per frame, at 60 frames per second, on a six-year-old laptop GPU.
It's a thing you leave running. Look up sometimes.
The rest of this post is reference material — what changed since the classic version, where each layer's data comes from, how it's built, and what's coming next. The story above is the whole story; the rest is the lookup table.
What's new since the classic version
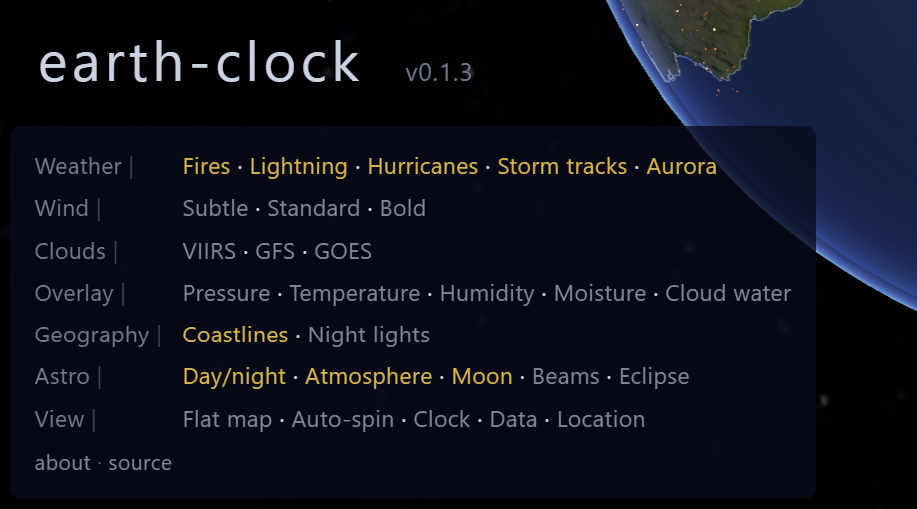
Earth-clock started as a fork of Cameron Beccario's cambecc/earth — the codebase behind earth.nullschool.net for over a decade — with a real-time day/night terminator and a clock display added on top. That version is still alive and well, archived at /classic/, with all eight of its original cartographic projections intact.
The current default at / is a ground-up rebuild for 2026. Same purpose, completely different engine.
What changed:
- WebGL2 + Three.js, replacing D3.js + HTML5 Canvas. Earth is now a textured sphere lit by a directional light positioned at the sun's actual sky-position, not a 2D map with a painted-on shadow.
- GPU wind particles. The classic version did CPU-side per-pixel particle advection; the rebuild puts 65,536 particles in a 256×256 RGBA-float texture and ticks them all in a single GPU compute pass each frame. The streamlines accumulate into a world-space trail buffer so they follow Earth's rotation rather than the camera.
- Real moon and stars. The moon sits at its true geocentric distance — 56 to 63 Earth radii away from us — at the correct sub-lunar latitude/longitude, and its phase emerges naturally from being lit by the same directional sun light that lights Earth. The stars behind everything come from Solar System Scope's photographic Milky Way map, oriented so the Milky Way is approximately where the real one is in the sky.
- A solar-eclipse renderer — the headline feature, targeting the 2026-08-12 total eclipse over northern Spain. Already covered above.
- Time-warp. Drag a slider in the clock controls and you can run simulated time at 60×, 1440× (a day per minute), or 86,400× (a year per second). Earth's rotation, the sun's position, the moon's phase, and the eclipse shadows all track the simulated clock together. Negative values run time in reverse.
- A location pin with reverse-geocoded place names — click anywhere on the globe (or "use my location") to read the coordinates, place name, and true solar time at that spot.
- A live data-freshness panel that lists every layer's data source with a coloured indicator showing whether it's fresh, stale, or failed. Click any source name to open the originating organisation's overview page.
Where the data comes from
Almost everything moving on the globe is fetched directly from public-domain scientific data feeds, almost all of them from US government agencies whose work is in the public domain:
| Layer | Source | Cadence |
|---|---|---|
| Clouds (true-colour daily mosaic) | NASA GIBS · VIIRS NOAA-20 | daily |
| Surface wind | NOAA NOMADS · GFS | every 6 h |
| Pressure / temperature / humidity / cloud water | NOAA NOMADS · GFS | every 6 h |
| Active fires | NASA FIRMS · VIIRS S-NPP NRT | hourly |
| Tropical cyclones (tracks + cones) | NOAA NHC | every 15 min |
| Aurora oval | NOAA SWPC · Ovation | every 5 min |
| Kp geomagnetic-activity index | NOAA SWPC | every 5 min |
| Lightning strikes | Blitzortung (community VLF network) | live stream (~200 ms) |
| Coastlines | Natural Earth 50 m | bundled |
| Eclipses | NASA GSFC · Espenak/Meeus predictions | bundled (4 events) |
| Earth + moon + starmap textures | Solar System Scope (CC-BY 4.0) | bundled |
The full bibliography — with attribution status, links to each source's policy page, and licensing notes for every texture and code library — lives in CREDITS.md. I'll keep adding to it as new layers land.
The one piece that isn't fetched directly from the browser is the GFS weather data. NOAA NOMADS publishes that as GRIB2 — a binary format optimised for size, not for browsers — so a small Node service on the server runs every six hours, downloads the current global forecast, decodes it to JSON using a pure-JavaScript GRIB2 parser, and writes the result to a static file the frontend can fetch. Same pipeline as the classic version of earth-clock; the only difference is which fields get extracted.
Architecture, briefly
For anyone who cares about how it's put together:
- Frontend: TypeScript + Vite + Three.js. Single-page app, no backend per page load.
- Wind particles: simulated on the GPU using a
GPUComputationRendererping-pong with two 256×256 RGBA float textures (positions + ages). Each step samples the wind vector field at the particle's(lon, lat), advects, and re-emits on a probabilistic basis. Streaks accumulate into a separate world-space render target with an additive blend and a slow exponential fade. - Atmosphere, clouds, eclipse shadow, sun + moon beams: custom GLSL fragment shaders on transparent concentric spherical shells around Earth, with explicit
renderOrderto keep alpha-sorting deterministic. - GFS weather pipeline: Node service runs every six hours, downloads GRIB2 from NOAA NOMADS, decodes with pure-JS
grib-js, writes JSON files topublic/data/weather/current/. - CORS proxy for the one upstream that doesn't ship CORS headers (NOAA NHC's tropical-cyclone feed): NGINX reverse-proxy rule on the production host; same URL pattern as the Vite dev proxy so application code is identical in dev and prod.
Production deployment is CapRover on a small VPS. The whole site fits in about 700 KB of compressed JavaScript plus the bundled textures (~10 MB total, mostly the Earth day/night maps and the Milky Way starmap). It opens in under a second on a modern connection.
What's next
The engineering tracker lives at the top of the repo in PLAN.md. The highlights for the next few releases:
- Flat-map should pan and zoom like the classic earth.nullschool projections. The current equirectangular view is pretty but inert; the classic site let you drag and zoom on every projection and the current version feels broken in comparison.
- Restore the other six classic projections — azimuthal equidistant, conic equidistant, stereographic, Waterman butterfly, Winkel tripel, Atlantis. The orthographic globe with a movable camera supersedes most of them visually, but parity with the original is a real feature gap. The Waterman butterfly and Atlantis are the visually striking ones, worth landing first.
- Eclipse path on the flat map — currently the 3D-only umbra-disc and path polyline need a 2D port.
- Pressure / temperature / humidity / moisture / cloud-water overlays — the classic site had these via GFS, the rebuild has the loaders in place but the visualisations need a polish round (the pressure overlay is currently mysteriously uniform — under investigation).
- A coherent policy for live data under time-warp. Right now most layers refresh on their own real-wall-clock cadences regardless of simulated time, so when you time-warp into an eclipse the globe shows today's weather over a different date. The eclipse path itself tracks simulated time correctly; nothing else does. Needs a design decision before going further.
- Windows screensaver + Wallpaper Engine outputs in the WebGL version. The classic codebase has both —
wallpaper-engine/andscreensaver/directories with their full pipelines — but they target the D3 canvas renderer. Porting them to the new WebGL version probably means either Electron wrapping a local-only build, or a.scrshim that spawns a fullscreen Chromium window. Worth a design doc before implementing.
Where to find it
- Live site: https://earth-clock.onemonkey.org/
- Source on GitHub: https://github.com/infantlab/earth-clock (MIT)
- Classic archive: https://earth-clock.onemonkey.org/classic/ — D3 + canvas, all eight original projections still draggable
- The original philosophical post: https://onemonkey.org/eclipses-equinoxes-and-everyday-awe-telling-the-time-on-spaceship-earth/ if you want the why before (or after) this what
- Bug reports, ideas, PRs: the issues page
Particularly interested in stories from anyone who watches the 2026 Spain eclipse in person, on a tablet running earth-clock as a second screen.