
May You Live in Exponential Times
Fewer things are exponential than the phrase suggests. The ones that are run faster than is comfortable, and the error bars matter more than the lines.


I asked an AI to fit thirteen technology curves, project each one to 2030 with honest error bars, and check whether its method would have worked in the past. Fewer things are exponential than the phrase suggests. The ones that are run faster than is comfortable, and the error bars matter more than the lines.
Data through mid-2026 · projections to 2030
“The greatest shortcoming of the human race is our inability to understand the exponential function.” — Albert Bartlett
A year ago I wrote an essay called “To Boldly Grow”, reporting on the energy think tank Ember’s argument that solar panels, batteries, electric motors and heat pumps add up to one machine, which they call electrotech (Ember, 2025). My bet was that this machine could make the basics of life close to free. Star Trek without the warp drive. I wrote it with what I called the frustrating assistance of GPT-5. The whole argument rested on a few curves going the right way very fast, and I never checked how fast, for how long, or how sure anyone could be.
So this time I didn’t do the work. I asked Claude Opus 5.5 to do it. It found the data for thirteen curves across computing, energy, transport, space and biology, wrote the code, fitted the trends, projected each one to 2030 with a 90% uncertainty band, and then did the step most trend charts skip. It pretended it was 2019, ran the same method, and checked those forecasts against what actually happened. It drafted these words too. My job was to argue with it, send it back when it was wrong, which it was more than once, and decide what any of it means.
That seemed only fair. One of the curves below measures how long a task an AI can do on its own. This essay is a data point on it.
“May you live in interesting times” is supposed to be an ancient Chinese curse. Nobody has ever found the Chinese. It is a confident claim that dissolves the moment you check it, and “exponential times” has the same problem: people say it as a mood. The point of all this was to find out which curves are actually exponential, how fast they are moving, and how far ahead anyone can honestly see.
Predicting the future, honestly
A forecast worth having comes in two parts: a best guess, and an honest statement of how wrong it might be. Most technology forecasts give you the first and skip the second. On an exponential the second part is the harder one, and the more important.
An ordinary forecast comes with a plus or minus: the bus will come at ten past, give or take five minutes. A forecast of something that multiplies can’t work like that, because the uncertainty is in the rate, and rates compound. Suppose space launches keep growing at somewhere between 25% and 45% a year. After five years the low rate has multiplied them by three and the high rate by more than six, and the gap between the two keeps widening, by multiplying, with every year you look ahead. So the honest error bar on an exponential isn’t plus or minus. It is times or divided by. For launches in 2030 it is about five either way: a central line of 20,000 a year, and a band from 3,800 to 108,000. In ordinary numbers that looks lopsided, with the top far above the middle. On a logarithmic scale, where each gridline is ten times the one below, it is symmetrical again, which is why every chart here uses one.
Putting a defensible width on that band was solved a decade ago. In “How predictable is technological progress?” (2016), Doyne Farmer and François Lafond model the logarithm of a technology’s cost as a drunk walking uphill. Each year it takes an average step plus some random lurch, and from that they derive how far off course a forecast can drift as the horizon lengthens.
They tested two versions against 53 technologies. In the simple one, each year’s lurch is independent of the last. It underestimated the real forecast errors by about half, and their tests threw it out. The version that passed lets part of each year’s surprise carry into the next, with a correlation, θ, of about 0.63. A drunk with momentum. That is the version behind every fitted band below.
Two house rules keep me honest. Every series is fitted on its last ten years of data, or its last eight observations where data are sparse, so I don’t get to pick the window that flatters a curve. And anything with a ceiling, like a market share that can’t pass 100%, is fitted as an S-curve rather than an exponential. A few curves, such as AI records, are measured at odd dates rather than once a year, and those get the same drunk with momentum, walking on the actual dates.
The same method lies behind Way, Ives, Mealy and Farmer (2022), who applied it to the whole energy transition and found that a fast transition is probably the cheaper one. Epoch AI’s public databases supplied three of the curves here.
Would it have worked?
A band like this makes two promises. The middle line will be wrong, and reality will stay inside the band about nine times in ten. To test both, the same method was run as if it were 2019: fit six curves on the ten years to 2019, forecast 2020 to 2025, and compare with what happened.
Start with the middle line.
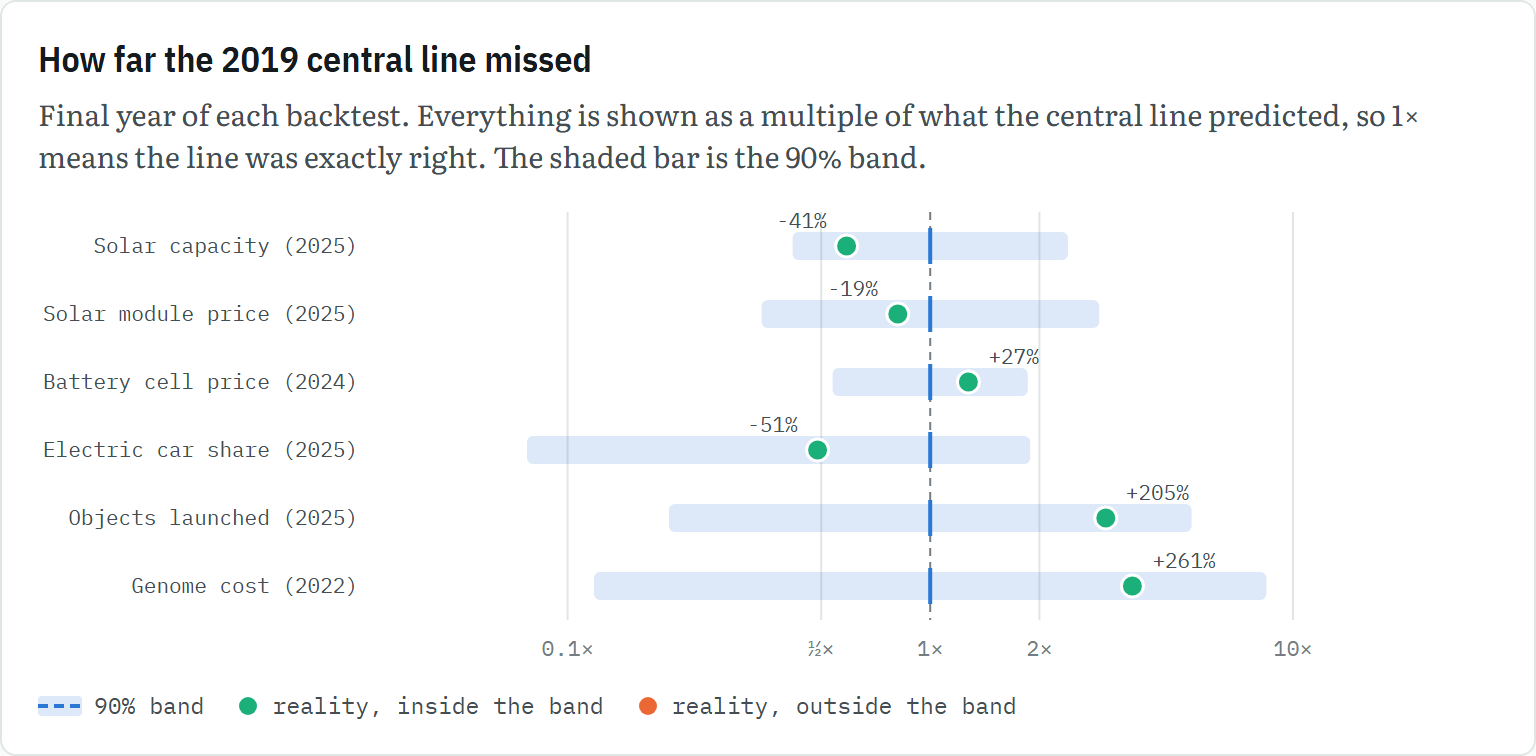
The 2019 forecast had solar capacity at 4,077 GW in 2025; the real figure was 2,397 GW, 41% lower. It had electric cars at 51% of new car sales; they managed 25%. It expected about 1,500 objects launched into space; there were 4,510, three times as many. It expected a genome to cost $146 by 2022; it cost $525. Solar modules came in 19% cheaper than forecast and battery cells 27% dearer. Not one of the six central lines came within 15% of reality, and they missed in both directions, so you can’t fix them by nudging them up or down. That is the first promise kept. Now the second.
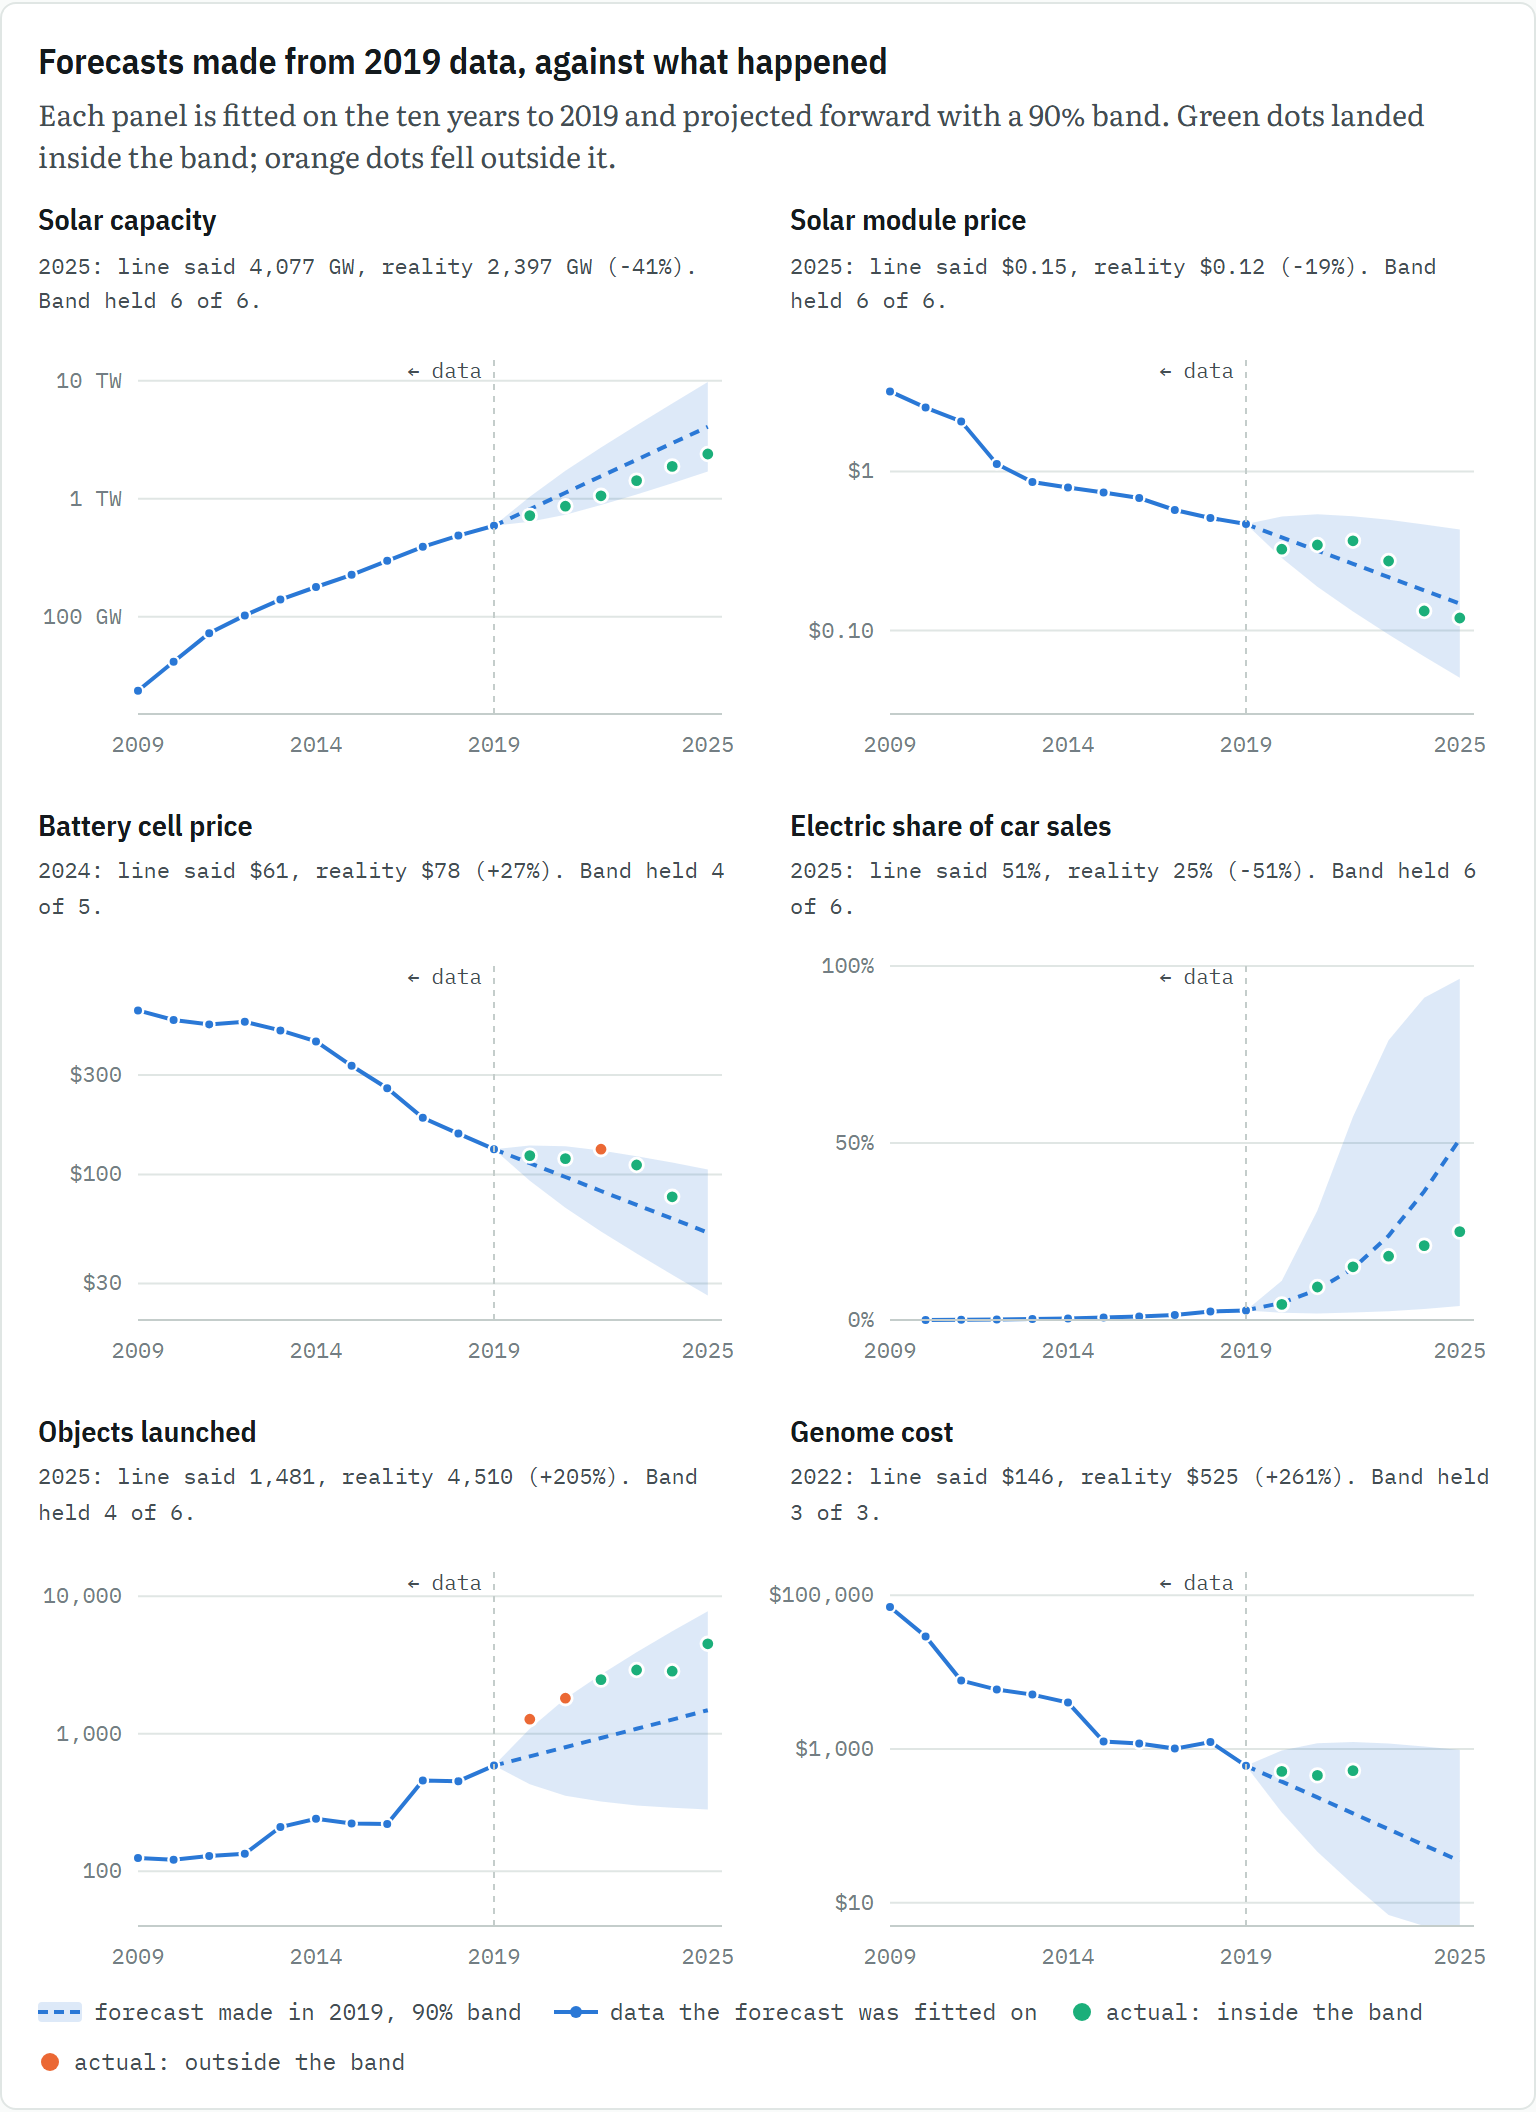
Of 32 actual values, 29 landed inside the 90% bands, close to the nine in ten a 90% band should catch. The three that escaped, in orange, escaped narrowly and briefly, and for different reasons. Battery cells cost $132 per kWh in 2022, just over the band’s ceiling of $130, when lithium and nickel prices spiked. The next year prices fell back and the curve was inside again. Space launches broke out of the top of their band in 2020 and 2021, when SpaceX began putting up Starlink satellites sixty at a time. By 2022 they were back inside, but not because launches slowed. They didn’t. The band had widened enough to catch them, which is the h²/m term in the box above doing its job: the further ahead you look, the more room it leaves for the trend itself to have changed. A point outside the band for a year isn’t a failed forecast. A curve that leaves the band and stays out would be.
The bands are honest and the middle line is not. Deployment curves in particular slow down before their trend line expects them to. So read every 2030 figure below as a range. The band is the forecast.
Looking ahead: now to 2030
That was the method marking its own homework on the past. From here on it points forward. Each chart below starts from the latest data, crosses a shaded strip to today (time that has happened but hasn’t been counted yet; we live in the shaded bit), and fans out to 2030. Nobody knows where any of these curves will be in 2030, but if the method keeps behaving as it did in the backtest, about nine in ten of them will land somewhere inside their fans.
Computing
How long can a machine keep at it?
The chart AI researchers share most is capability over time. The research group METR measures it with a lovely, human unit: how long a task an AI agent can finish, half the time, where “how long” means how long the task takes a skilled person.
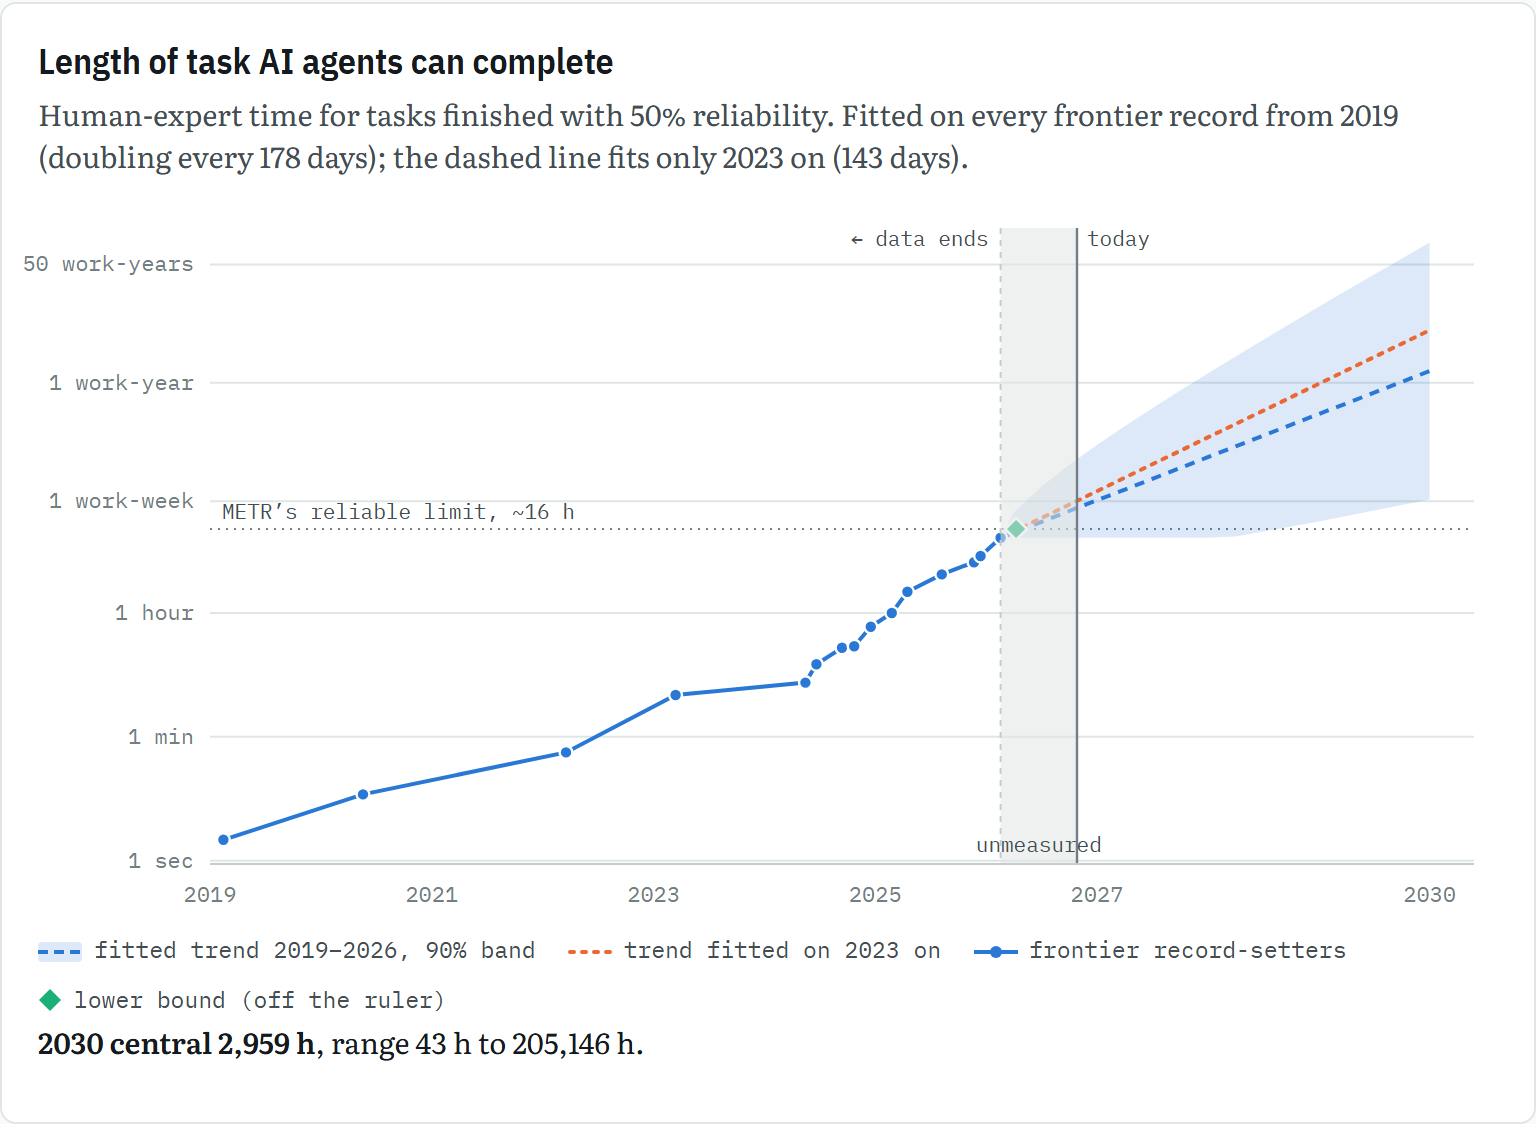
On the ground. In 2019 the frontier could manage reading a sentence. In 2025, a long meeting. In February 2026, about a day and a half of work.
Show the numbers
| Year | Series | Value | Range / note |
|---|---|---|---|
| 2026.1 | fitted trend 2019–2026, 90% band | 12 h | 12 h to 12 h |
| 2026.3 | fitted trend 2019–2026, 90% band | 14 h | 12 h to 28 h |
| 2026.5 | fitted trend 2019–2026, 90% band | 20 h | 12 h to 65 h |
| 2026.8 | fitted trend 2019–2026, 90% band | 29 h | 12 h to 133 h |
| 2027 | fitted trend 2019–2026, 90% band | 41 h | 12 h to 257 h |
| 2027.3 | fitted trend 2019–2026, 90% band | 59 h | 12 h to 477 h |
| 2027.5 | fitted trend 2019–2026, 90% band | 84 h | 12 h to 867 h |
| 2027.8 | fitted trend 2019–2026, 90% band | 120 h | 12 h to 1,551 h |
| 2028 | fitted trend 2019–2026, 90% band | 172 h | 12 h to 2,739 h |
| 2028.3 | fitted trend 2019–2026, 90% band | 245 h | 13 h to 4,793 h |
| 2028.5 | fitted trend 2019–2026, 90% band | 350 h | 15 h to 8,321 h |
| 2028.8 | fitted trend 2019–2026, 90% band | 499 h | 17 h to 14,355 h |
| 2029 | fitted trend 2019–2026, 90% band | 713 h | 21 h to 24,630 h |
| 2029.3 | fitted trend 2019–2026, 90% band | 1,017 h | 25 h to 42,070 h |
| 2029.5 | fitted trend 2019–2026, 90% band | 1,452 h | 29 h to 71,575 h |
| 2029.8 | fitted trend 2019–2026, 90% band | 2,073 h | 35 h to 121,357 h |
| 2030 | fitted trend 2019–2026, 90% band | 2,959 h | 43 h to 205,146 h |
| 2026.1 | trend fitted on 2023 on | 12 h | |
| 2026.3 | trend fitted on 2023 on | 15 h | |
| 2026.5 | trend fitted on 2023 on | 23 h | |
| 2026.8 | trend fitted on 2023 on | 36 h | |
| 2027 | trend fitted on 2023 on | 56 h | |
| 2027.3 | trend fitted on 2023 on | 87 h | |
| 2027.5 | trend fitted on 2023 on | 136 h | |
| 2027.8 | trend fitted on 2023 on | 211 h | |
| 2028 | trend fitted on 2023 on | 329 h | |
| 2028.3 | trend fitted on 2023 on | 513 h | |
| 2028.5 | trend fitted on 2023 on | 799 h | |
| 2028.8 | trend fitted on 2023 on | 1,244 h | |
| 2029 | trend fitted on 2023 on | 1,937 h | |
| 2029.3 | trend fitted on 2023 on | 3,016 h | |
| 2029.5 | trend fitted on 2023 on | 4,697 h | |
| 2029.8 | trend fitted on 2023 on | 7,315 h | |
| 2030 | trend fitted on 2023 on | 11,392 h | |
| 2019.1 | frontier record-setters | 2 s | GPT-2: 2 s |
| 2020.4 | frontier record-setters | 9 s | GPT-3: 9 s |
| 2022.2 | frontier record-setters | 36 s | GPT-3.5: 36 s |
| 2023.2 | frontier record-setters | 4 min | GPT-4: 4 min |
| 2024.4 | frontier record-setters | 6 min | GPT-4o: 6 min |
| 2024.5 | frontier record-setters | 11 min | Claude 3.5 Sonnet: 11 min |
| 2024.7 | frontier record-setters | 19 min | o1-preview: 19 min |
| 2024.8 | frontier record-setters | 20 min | Claude 3.5 Sonnet (new): 20 min |
| 2025.0 | frontier record-setters | 38 min | o1: 38 min |
| 2025.2 | frontier record-setters | 1 h | Claude 3.7 Sonnet: 1.0 h |
| 2025.3 | frontier record-setters | 2 h | o3: 2.0 h |
| 2025.6 | frontier record-setters | 3.6 h | GPT-5: 3.6 h |
| 2025.9 | frontier record-setters | 5.3 h | Claude Opus 4.5: 5.3 h |
| 2026.0 | frontier record-setters | 6.6 h | GPT-5.2: 6.6 h |
| 2026.1 | frontier record-setters | 12 h | Claude Opus 4.6: 12.0 h |
| 2026.3 | lower bound (off the ruler) | 16 h | Claude Mythos Preview (Apr 2026): at least 16 h |
In February 2019, GPT-2 could manage a two-second task, roughly the time it takes to read this sentence. By August 2025, GPT-5 could manage three and a half hours, a long meeting. In February 2026, Claude Opus 4.6 managed about twelve hours, a day and a half of work. Two months later Claude Mythos Preview went off the end of METR’s ruler, at sixteen hours or more, which is as far as its current tasks can reliably measure. Only five of its 228 tasks take a person that long. In September 2026 METR stopped updating the tracker.
Fitted on every record-setter since 2019, the task length doubles about every six months. Carried to 2030, the central line reaches about 3,000 hours, a year and a half of someone’s working life. But look at the fan. It runs from about 43 hours, a week’s work, to about 210,000 hours, a century. A frontier that arrives in lumps, measured on a ruler that has already run out, can’t honestly be forecast more tightly than that. Here more than anywhere, the band is the forecast. If you had to bet on which half of it, recent history says the top: when Benjamin Todd marked eighteen months of AI forecasts, almost every miss was on the slow side (Todd, 2026). That’s why the dashed line, fitted only on the faster years since 2023, is worth watching.
The price of a thought
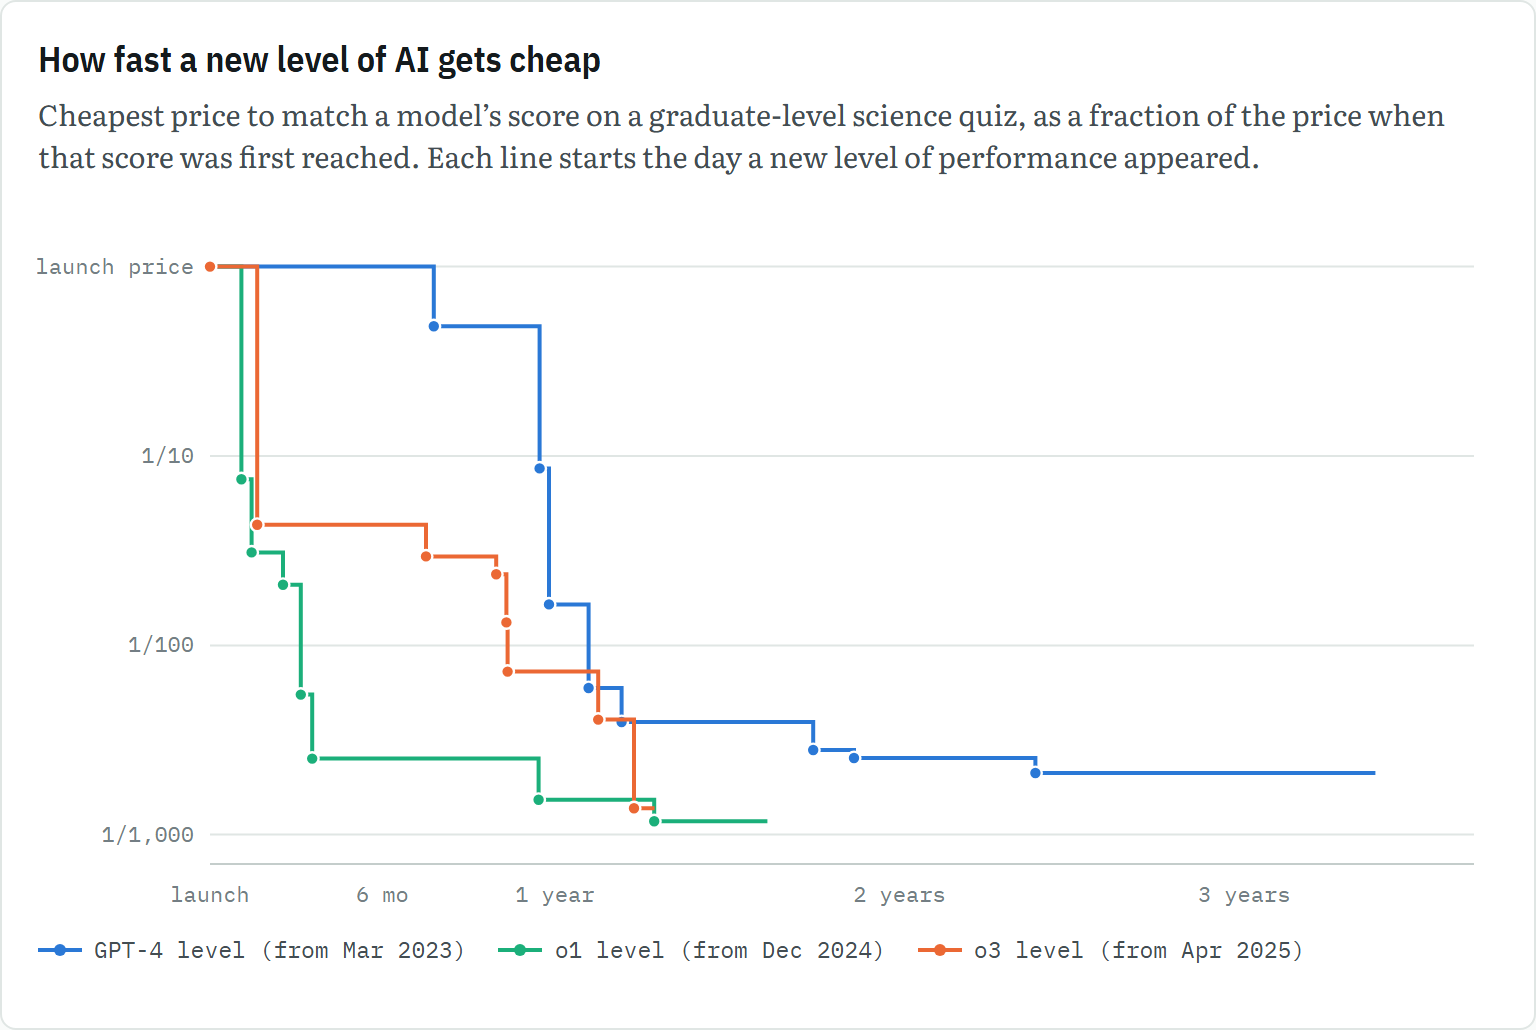
On the ground. One year after each level first appeared, the same answers cost between 1/61 and 1/654 of the launch price.
Show the numbers
| Year | Series | Value | Range / note |
|---|---|---|---|
| 0 | GPT-4 level (from Mar 2023) | launch price | GPT-4 (2023-03): launch price 3.1¢ a question |
| 7.8 | GPT-4 level (from Mar 2023) | 1/2.1 | GPT-4 Turbo (2023-11): 1/2 of the launch price |
| 11.5 | GPT-4 level (from Mar 2023) | 1/12 | Mistral Large (2024-02): 1/12 of the launch price |
| 11.8 | GPT-4 level (from Mar 2023) | 1/61 | Claude 3 Haiku (2024-03): 1/61 of the launch price |
| 13.2 | GPT-4 level (from Mar 2023) | 1/170 | Llama 3 70B (2024-04): 1/168 of the launch price |
| 14.3 | GPT-4 level (from Mar 2023) | 1/250 | Gemini 1.5 Flash (2024-05): 1/254 of the launch price |
| 21 | GPT-4 level (from Mar 2023) | 1/360 | Phi-4 (2024-12): 1/357 of the launch price |
| 22.4 | GPT-4 level (from Mar 2023) | 1/390 | Mistral Small 3 (2025-01): 1/394 of the launch price |
| 28.7 | GPT-4 level (from Mar 2023) | 1/470 | gpt-oss-20b (2025-08): 1/473 of the launch price |
| 40.6 | GPT-4 level (from Mar 2023) | 1/470 | no cheaper model by mid-2026 |
| 0 | o1 level (from Dec 2024) | launch price | o1 (2024-12): launch price 23.0¢ a question |
| 1.1 | o1 level (from Dec 2024) | 1/13 | DeepSeek-R1 (2025-01): 1/13 of the launch price |
| 1.4 | o1 level (from Dec 2024) | 1/32 | o3-mini (2025-01): 1/32 of the launch price |
| 2.5 | o1 level (from Dec 2024) | 1/48 | QwQ-32B (2025-03): 1/48 of the launch price |
| 3.2 | o1 level (from Dec 2024) | 1/180 | DeepSeek-V3 (2025-03): 1/182 of the launch price |
| 3.6 | o1 level (from Dec 2024) | 1/400 | Llama 4 Maverick (2025-04): 1/396 of the launch price |
| 11.4 | o1 level (from Dec 2024) | 1/650 | DeepSeek V3.2 (2025-12): 1/654 of the launch price |
| 15.5 | o1 level (from Dec 2024) | 1/850 | Gemma 4 31B (2026-04): 1/849 of the launch price |
| 19.4 | o1 level (from Dec 2024) | 1/850 | no cheaper model by mid-2026 |
| 0 | o3 level (from Apr 2025) | launch price | o3 (high) (2025-04): launch price 29.9¢ a question |
| 1.6 | o3 level (from Apr 2025) | 1/23 | Gemini 2.5 Pro (2025-06): 1/23 of the launch price |
| 7.5 | o3 level (from Apr 2025) | 1/34 | DeepSeek V3.2 (2025-12): 1/34 of the launch price |
| 10.0 | o3 level (from Apr 2025) | 1/42 | Qwen3.5 397B (2026-02): 1/42 of the launch price |
| 10.3 | o3 level (from Apr 2025) | 1/76 | Qwen3.5 35B (2026-02): 1/76 of the launch price |
| 10.4 | o3 level (from Apr 2025) | 1/140 | Qwen3.5 Flash (2026-02): 1/138 of the launch price |
| 13.5 | o3 level (from Apr 2025) | 1/250 | MiniMax-M3 (2026-06): 1/247 of the launch price |
| 14.8 | o3 level (from Apr 2025) | 1/730 | GPT-5.6 Luna (2026-07): 1/725 of the launch price |
| 15.5 | o3 level (from Apr 2025) | 1/730 | no cheaper model by mid-2026 |
The other half of capability is what it costs. For “The plunging price of thought” (September 2026), Epoch AI measured the cheapest way to reach a given score on a graduate-level science quiz, counting both each model’s price and how many words it needed to think. They published the data, which runs to mid-2026. The chart takes three levels of performance, those first reached by GPT-4, o1 and o3, and follows each from the day it appeared, as a fraction of its launch price.
All three tell the same story. One year on, the same answers cost between a sixtieth and a six-hundred-and-fiftieth of the launch price. Then the fall lands on a floor: the GPT-4 level has been flat for more than a year, at about a five-hundredth of what it first cost. The price of a given level of intelligence falls off a cliff and then stops. I haven’t projected this chart, but it makes one claim worth checking: whatever the best model does today, something will do next October at a sixtieth to a six-hundred-and-fiftieth of the price. ChatGPT had over 900 million weekly users by February 2026, which is a lot of people using something that was a research demo three and a half years earlier.
The power gap
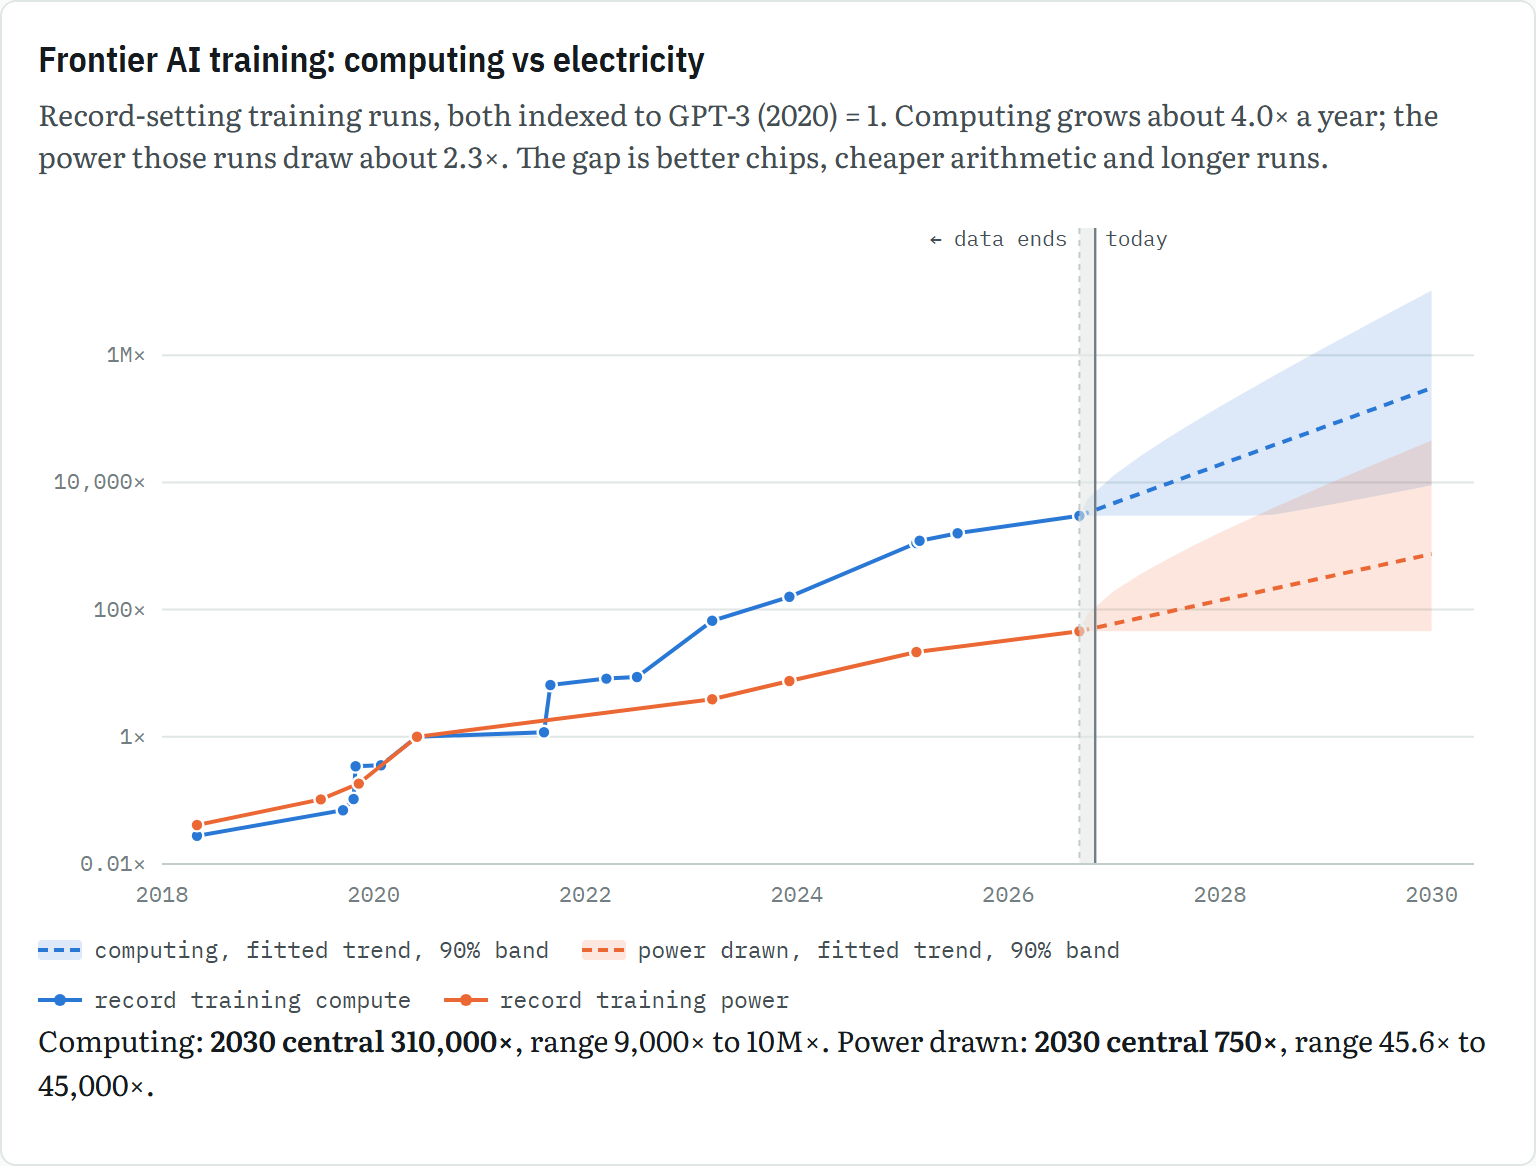
On the ground. GPT-3 trained on about 5 MW, roughly a small town’s worth of homes. GPT-6 Astra drew about 233 MW. The 2030 central line, about 4 GW, is the output of four large nuclear reactors for one training run (rough sum).
Show the numbers
| Year | Series | Value | Range / note |
|---|---|---|---|
| 2026.7 | computing, fitted trend, 90% band | 3,000× | 3,000× to 3,000× |
| 2026.8 | computing, fitted trend, 90% band | 3,300× | 3,000× to 5,500× |
| 2027 | computing, fitted trend, 90% band | 4,700× | 3,000× to 13,000× |
| 2027.3 | computing, fitted trend, 90% band | 6,700× | 3,000× to 26,000× |
| 2027.5 | computing, fitted trend, 90% band | 9,500× | 3,000× to 49,000× |
| 2027.8 | computing, fitted trend, 90% band | 13,000× | 3,000× to 88,000× |
| 2028 | computing, fitted trend, 90% band | 19,000× | 3,000× to 160,000× |
| 2028.3 | computing, fitted trend, 90% band | 27,000× | 3,000× to 270,000× |
| 2028.5 | computing, fitted trend, 90% band | 38,000× | 3,100× to 470,000× |
| 2028.8 | computing, fitted trend, 90% band | 54,000× | 3,600× to 790,000× |
| 2029 | computing, fitted trend, 90% band | 76,000× | 4,300× to 1.3M× |
| 2029.3 | computing, fitted trend, 90% band | 110,000× | 5,200× to 2.3M× |
| 2029.5 | computing, fitted trend, 90% band | 150,000× | 6,200× to 3.8M× |
| 2029.8 | computing, fitted trend, 90% band | 220,000× | 7,500× to 6.3M× |
| 2030 | computing, fitted trend, 90% band | 310,000× | 9,000× to 10M× |
| 2026.7 | power drawn, fitted trend, 90% band | 45.6× | 45.6× to 45.6× |
| 2026.8 | power drawn, fitted trend, 90% band | 48.8× | 45.6× to 87.1× |
| 2027 | power drawn, fitted trend, 90% band | 60.2× | 45.6× to 200× |
| 2027.3 | power drawn, fitted trend, 90% band | 74.3× | 45.6× to 360× |
| 2027.5 | power drawn, fitted trend, 90% band | 91.7× | 45.6× to 620× |
| 2027.8 | power drawn, fitted trend, 90% band | 110× | 45.6× to 1,000× |
| 2028 | power drawn, fitted trend, 90% band | 140× | 45.6× to 1,600× |
| 2028.3 | power drawn, fitted trend, 90% band | 170× | 45.6× to 2,500× |
| 2028.5 | power drawn, fitted trend, 90% band | 210× | 45.6× to 3,900× |
| 2028.8 | power drawn, fitted trend, 90% band | 260× | 45.6× to 6,000× |
| 2029 | power drawn, fitted trend, 90% band | 320× | 45.6× to 9,200× |
| 2029.3 | power drawn, fitted trend, 90% band | 400× | 45.6× to 14,000× |
| 2029.5 | power drawn, fitted trend, 90% band | 490× | 45.6× to 21,000× |
| 2029.8 | power drawn, fitted trend, 90% band | 610× | 45.6× to 31,000× |
| 2030 | power drawn, fitted trend, 90% band | 750× | 45.6× to 45,000× |
| 2018.3 | record training compute | 0.0278× | ResNeXt-101: 8.7e+21 operations |
| 2019.7 | record training compute | 0.0701× | Megatron-BERT: 2.2e+22 operations |
| 2019.8 | record training compute | 0.105× | T5-11B: 3.3e+22 operations |
| 2019.8 | record training compute | 0.344× | AlphaStar: 1.1e+23 operations |
| 2020.1 | record training compute | 0.357× | Meena: 1.1e+23 operations |
| 2020.4 | record training compute | 1× | GPT-3: 3.1e+23 operations |
| 2021.6 | record training compute | 1.18× | Jurassic-1-Jumbo: 3.7e+23 operations |
| 2021.7 | record training compute | 6.53× | FLAN 137B: 2.1e+24 operations |
| 2022.2 | record training compute | 8.22× | GPT-3.5: 2.6e+24 operations |
| 2022.5 | record training compute | 8.73× | Minerva: 2.7e+24 operations |
| 2023.2 | record training compute | 66.9× | GPT-4: 2.1e+25 operations |
| 2023.9 | record training compute | 160× | Gemini 1.0 Ultra: 5.0e+25 operations |
| 2025.1 | record training compute | 1,100× | Grok 3: 3.5e+26 operations |
| 2025.2 | record training compute | 1,200× | GPT-4.5: 3.8e+26 operations |
| 2025.5 | record training compute | 1,600× | Grok 4: 5.0e+26 operations |
| 2026.7 | record training compute | 3,000× | GPT-6 Astra: 9.4e+26 operations |
| 2018.3 | record training power | 0.0412× | ResNeXt-101: 0.2 MW |
| 2019.5 | record training power | 0.104× | RoBERTa Large: 0.5 MW |
| 2019.9 | record training power | 0.184× | Noisy Student: 0.9 MW |
| 2020.4 | record training power | 1× | GPT-3: 5.1 MW |
| 2023.2 | record training power | 3.91× | GPT-4: 19.9 MW |
| 2023.9 | record training power | 7.53× | Gemini 1.0 Ultra: 38.4 MW |
| 2025.1 | record training power | 21.6× | Grok 3: 110.0 MW |
| 2026.7 | record training power | 45.6× | GPT-6 Astra: 232.7 MW |
Epoch AI also keeps a database of notable AI models, with an estimate of how much computing went into training each one and how much electricity the training run drew. Take the record-setters since 2018. GPT-3, in 2020, was trained with about 3×10²³ operations on about 5 megawatts. GPT-6 Astra, in September 2026, used about 9×10²⁶ operations on about 233 megawatts. Computing went up about 3,000 times; power about 46 times.
Fitted, computing grows about 4 times a year and power 2.3 times. The gap between those two is better chips, cheaper low-precision arithmetic and longer runs. The rest has to come off the grid. On the central line, one training run in 2030 draws about 4 gigawatts. The band is wide, from today’s record of about a quarter of a gigawatt (a record can’t go backwards) up to more than 200, because new records arrive in lumps and the fan has to allow for that. A gigawatt, running all year, is about what 800,000 American homes use. Epoch’s analysis of scaling to 2030 names electrical power as one of the binding constraints, and you can see why. The fastest curve in this essay is tethered to an energy curve, which is where the electrotech comes in.
Moore’s Law moved house
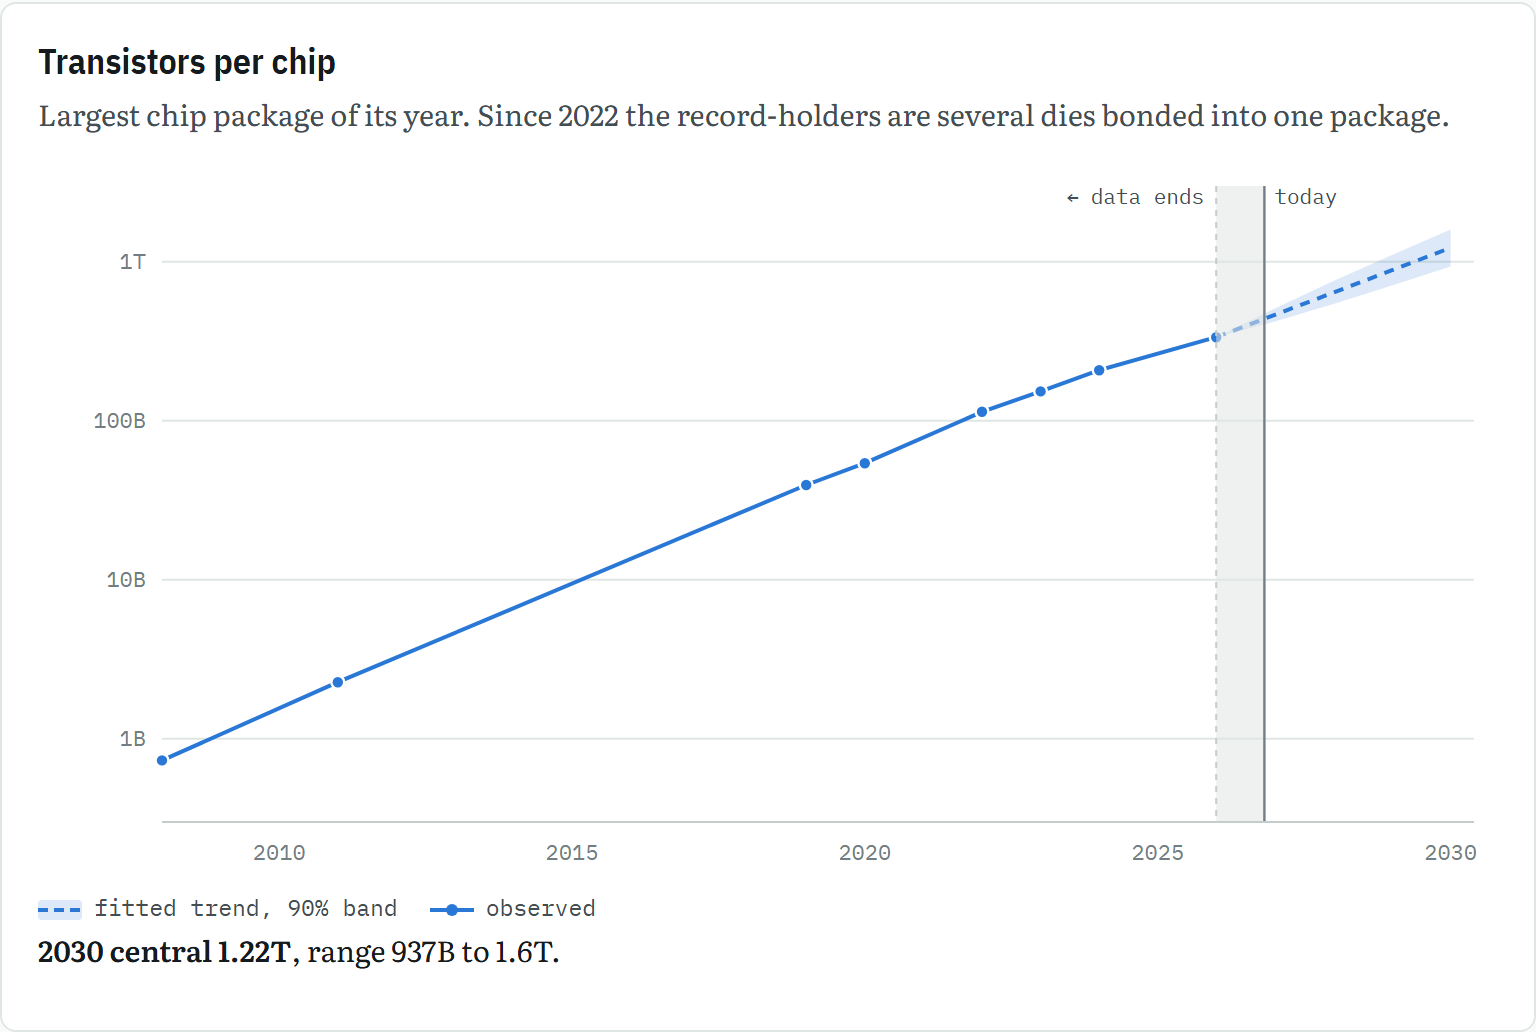
On the ground. About 140 transistors for every person alive, in one 2030 chip package (1.2 trillion ÷ 8.5 billion; rough sum).
Show the numbers
| Year | Series | Value | Range / note |
|---|---|---|---|
| 2026 | fitted trend, 90% band | 336B | 336B to 336B |
| 2027 | fitted trend, 90% band | 464B | 422B to 510B |
| 2028 | fitted trend, 90% band | 641B | 543B to 758B |
| 2029 | fitted trend, 90% band | 886B | 710B to 1.11T |
| 2030 | fitted trend, 90% band | 1.22T | 937B to 1.6T |
| 1971 | observed | 2,250 | |
| 1972 | observed | 3,500 | |
| 1974 | observed | 6,000 | |
| 1978 | observed | 29,000 | |
| 1982 | observed | 134,000 | |
| 1985 | observed | 275,000 | |
| 1989 | observed | 1.18M | |
| 1993 | observed | 3.1M | |
| 1995 | observed | 5.5M | |
| 1998 | observed | 7.5M | |
| 2000 | observed | 42M | |
| 2004 | observed | 112M | |
| 2006 | observed | 291M | |
| 2008 | observed | 731M | |
| 2011 | observed | 2.27B | |
| 2019 | observed | 39.5B | |
| 2020 | observed | 54.2B | |
| 2022 | observed | 114B | |
| 2023 | observed | 153B | |
| 2024 | observed | 208B | |
| 2026 | observed | 336B |
For years I believed, along with most people who read technology news, that Moore’s Law was slowing down. On single chips, it has. The largest single slab of silicon went from 80 billion transistors in 2022 to 92 billion in 2025, which is barely a stroll.
But the record-holders stopped being single chips. Apple, AMD and Nvidia now bond several dies into one package and sell it as one processor, and counted that way the curve hasn’t slowed at all. Nvidia’s Rubin, in 2026, carries 336 billion transistors. Growth since 2015 is 36% a year, within a few points of the rate since 1971. Moore’s Law didn’t die. It moved into a bigger house and took in lodgers. The central projection is about 1.2 trillion transistors in a single package by 2030, more than a hundred for every person alive.
Energy
Solar modules
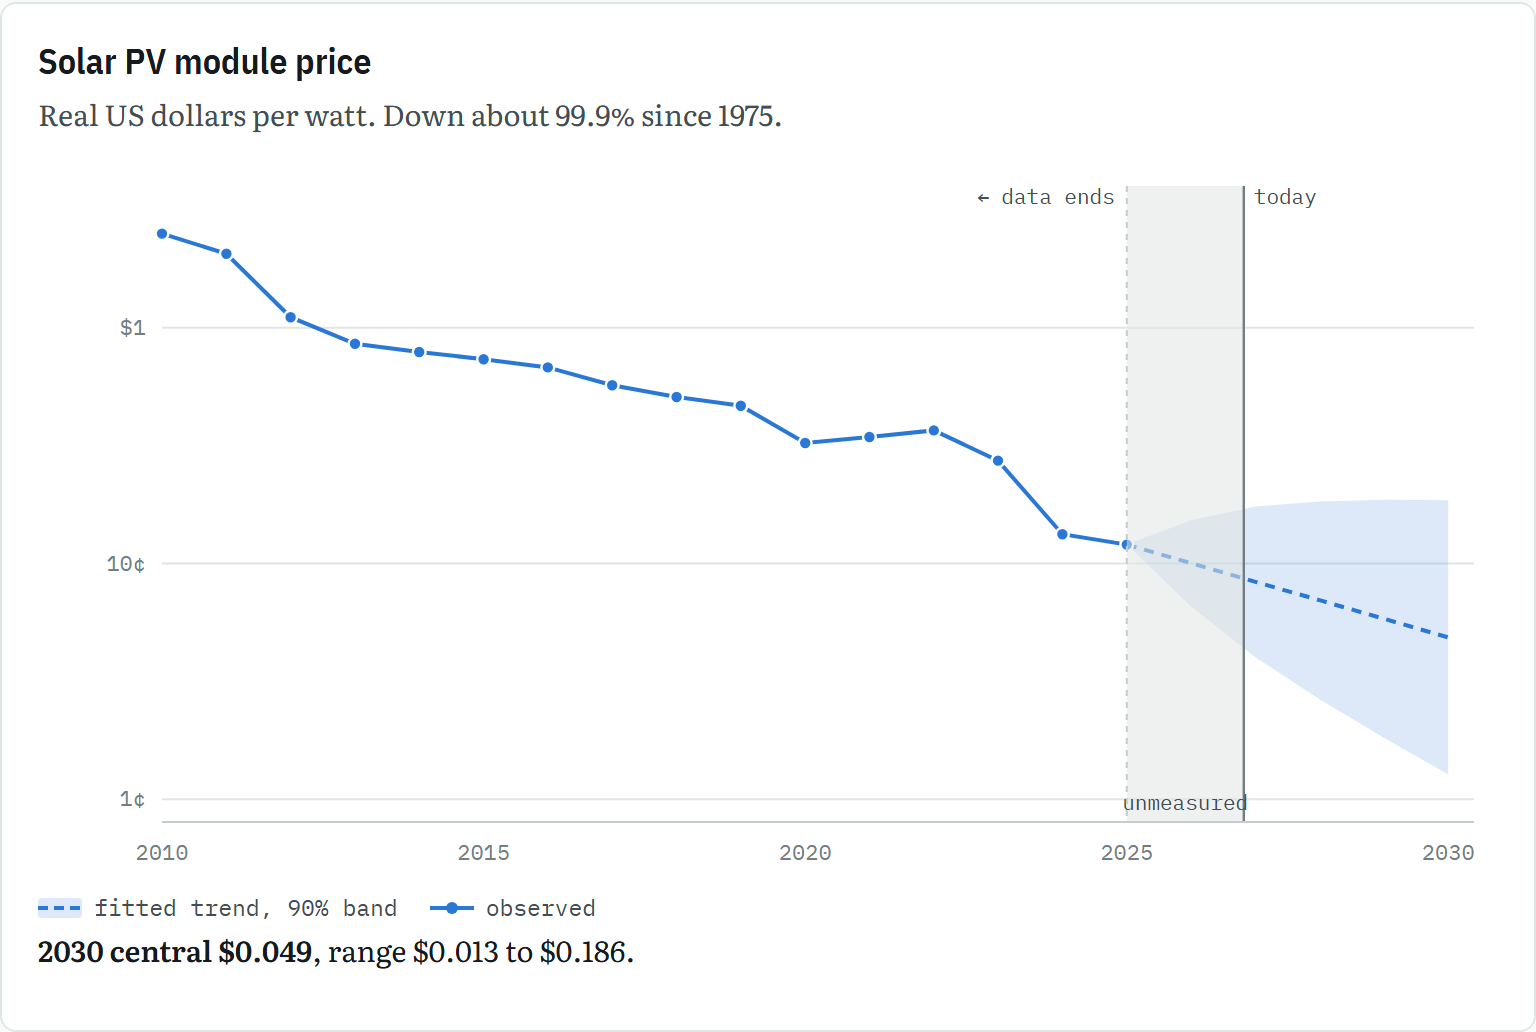
On the ground. Panels for a 4 kW British roof would cost about £150 in 2030, less than the £400–£1,000 for the scaffolding to put them up (rough sum).
Show the numbers
| Year | Series | Value | Range / note |
|---|---|---|---|
| 2025 | fitted trend, 90% band | $0.120 | $0.120 to $0.120 |
| 2026 | fitted trend, 90% band | $0.100 | $0.066 to $0.153 |
| 2027 | fitted trend, 90% band | $0.084 | $0.040 to $0.175 |
| 2028 | fitted trend, 90% band | $0.070 | $0.027 to $0.184 |
| 2029 | fitted trend, 90% band | $0.058 | $0.018 to $0.186 |
| 2030 | fitted trend, 90% band | $0.049 | $0.013 to $0.186 |
| 1975 | observed | $132 | |
| 1976 | observed | $100 | |
| 1977 | observed | $73 | |
| 1978 | observed | $51 | |
| 1979 | observed | $43 | |
| 1980 | observed | $37 | |
| 1981 | observed | $29 | |
| 1982 | observed | $26 | |
| 1983 | observed | $21 | |
| 1984 | observed | $20 | |
| 1985 | observed | $17 | |
| 1986 | observed | $14 | |
| 1987 | observed | $12 | |
| 1988 | observed | $11 | |
| 1989 | observed | $12 | |
| 1990 | observed | $12 | |
| 1991 | observed | $11 | |
| 1992 | observed | $10 | |
| 1993 | observed | $9.76 | |
| 1994 | observed | $9.23 | |
| 1995 | observed | $8.54 | |
| 1996 | observed | $7.98 | |
| 1997 | observed | $7.95 | |
| 1998 | observed | $7.17 | |
| 1999 | observed | $6.62 | |
| 2000 | observed | $6.50 | |
| 2001 | observed | $6.28 | |
| 2002 | observed | $5.75 | |
| 2003 | observed | $5.46 | |
| 2004 | observed | $4.70 | |
| 2005 | observed | $4.75 | |
| 2006 | observed | $5.17 | |
| 2007 | observed | $5.21 | |
| 2008 | observed | $4.75 | |
| 2009 | observed | $3.17 | |
| 2010 | observed | $2.51 | |
| 2011 | observed | $2.06 | |
| 2012 | observed | $1.11 | |
| 2013 | observed | $0.857 | |
| 2014 | observed | $0.791 | |
| 2015 | observed | $0.736 | |
| 2016 | observed | $0.680 | |
| 2017 | observed | $0.571 | |
| 2018 | observed | $0.509 | |
| 2019 | observed | $0.467 | |
| 2020 | observed | $0.325 | |
| 2021 | observed | $0.345 | |
| 2022 | observed | $0.367 | |
| 2023 | observed | $0.273 | |
| 2024 | observed | $0.133 | |
| 2025 | observed | $0.120 |
A solar module cost $132 per watt in 1975 and 12 cents in 2025, in today’s money. Over the last decade the price fell 16.6% a year. Fitted from 2000 the rate is 14.8%, and from 1975 13.1%. Through oil shocks, a polysilicon shortage, trade wars and a glut, the slope barely moved in fifty years. That steadiness is what makes the curve forecastable, and it underpins the Way et al. result. The central projection is about 5 cents a watt by 2030.
Solar deployment
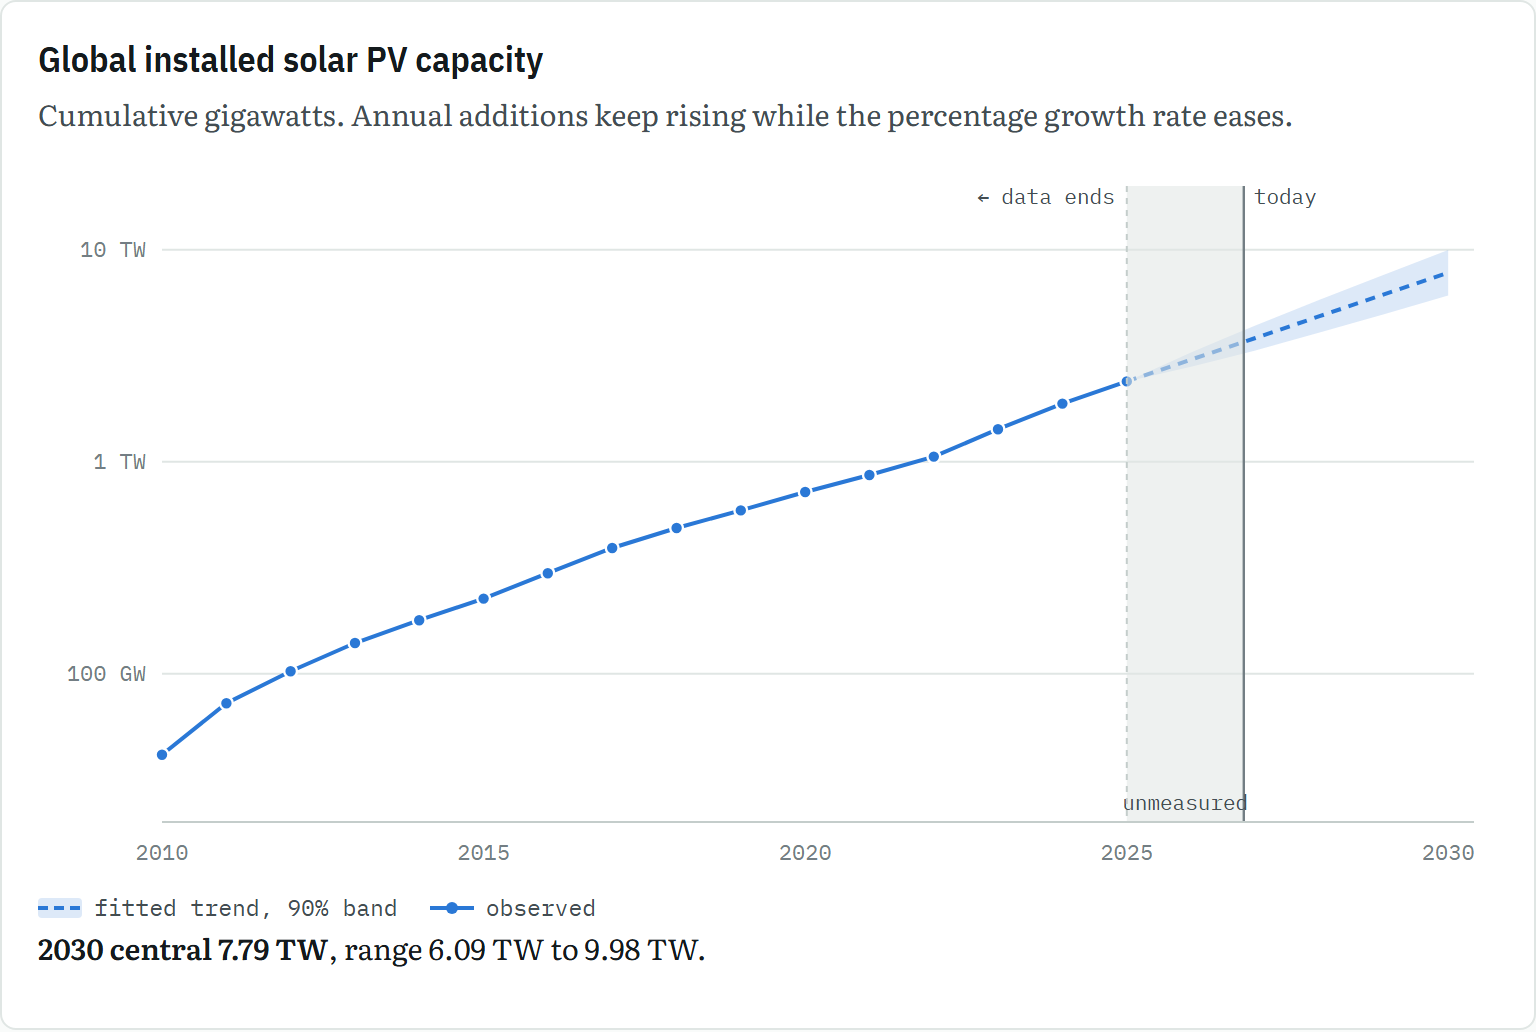
On the ground. About three-quarters of a 400-watt panel per person in 2025. On the central line, more than two each by 2030 (rough sum).
Show the numbers
| Year | Series | Value | Range / note |
|---|---|---|---|
| 2025 | fitted trend, 90% band | 2.40 TW | 2.40 TW to 2.40 TW |
| 2026 | fitted trend, 90% band | 3.03 TW | 2.81 TW to 3.28 TW |
| 2027 | fitted trend, 90% band | 3.84 TW | 3.35 TW to 4.40 TW |
| 2028 | fitted trend, 90% band | 4.86 TW | 4.07 TW to 5.81 TW |
| 2029 | fitted trend, 90% band | 6.16 TW | 4.97 TW to 7.63 TW |
| 2030 | fitted trend, 90% band | 7.79 TW | 6.09 TW to 9.98 TW |
| 2000 | observed | 1.2 GW | |
| 2001 | observed | 1.3 GW | |
| 2002 | observed | 1.6 GW | |
| 2003 | observed | 2.3 GW | |
| 2004 | observed | 3.4 GW | |
| 2005 | observed | 4.9 GW | |
| 2006 | observed | 6.5 GW | |
| 2007 | observed | 9.0 GW | |
| 2008 | observed | 15 GW | |
| 2009 | observed | 24 GW | |
| 2010 | observed | 41 GW | |
| 2011 | observed | 73 GW | |
| 2012 | observed | 103 GW | |
| 2013 | observed | 140 GW | |
| 2014 | observed | 179 GW | |
| 2015 | observed | 227 GW | |
| 2016 | observed | 299 GW | |
| 2017 | observed | 392 GW | |
| 2018 | observed | 488 GW | |
| 2019 | observed | 590 GW | |
| 2020 | observed | 721 GW | |
| 2021 | observed | 866 GW | |
| 2022 | observed | 1.06 TW | |
| 2023 | observed | 1.42 TW | |
| 2024 | observed | 1.88 TW | |
| 2025 | observed | 2.40 TW |
Installed solar capacity reached about 2,400 GW in 2025, after growing 26.6% a year for a decade. The percentage rate is easing, from 35% a year since 2000 to 27% since 2015, even as each year’s additions get bigger. The central projection is 7.8 TW by 2030, with a band of 6.1 to 10 TW. The band is narrow because the last ten years were steady, but the backtest caught this method overshooting solar by 41%, so treat the upper half with suspicion. Solar made about 9% of the world’s electricity in 2025, according to Ember, so its ceiling is a long way off.
Batteries
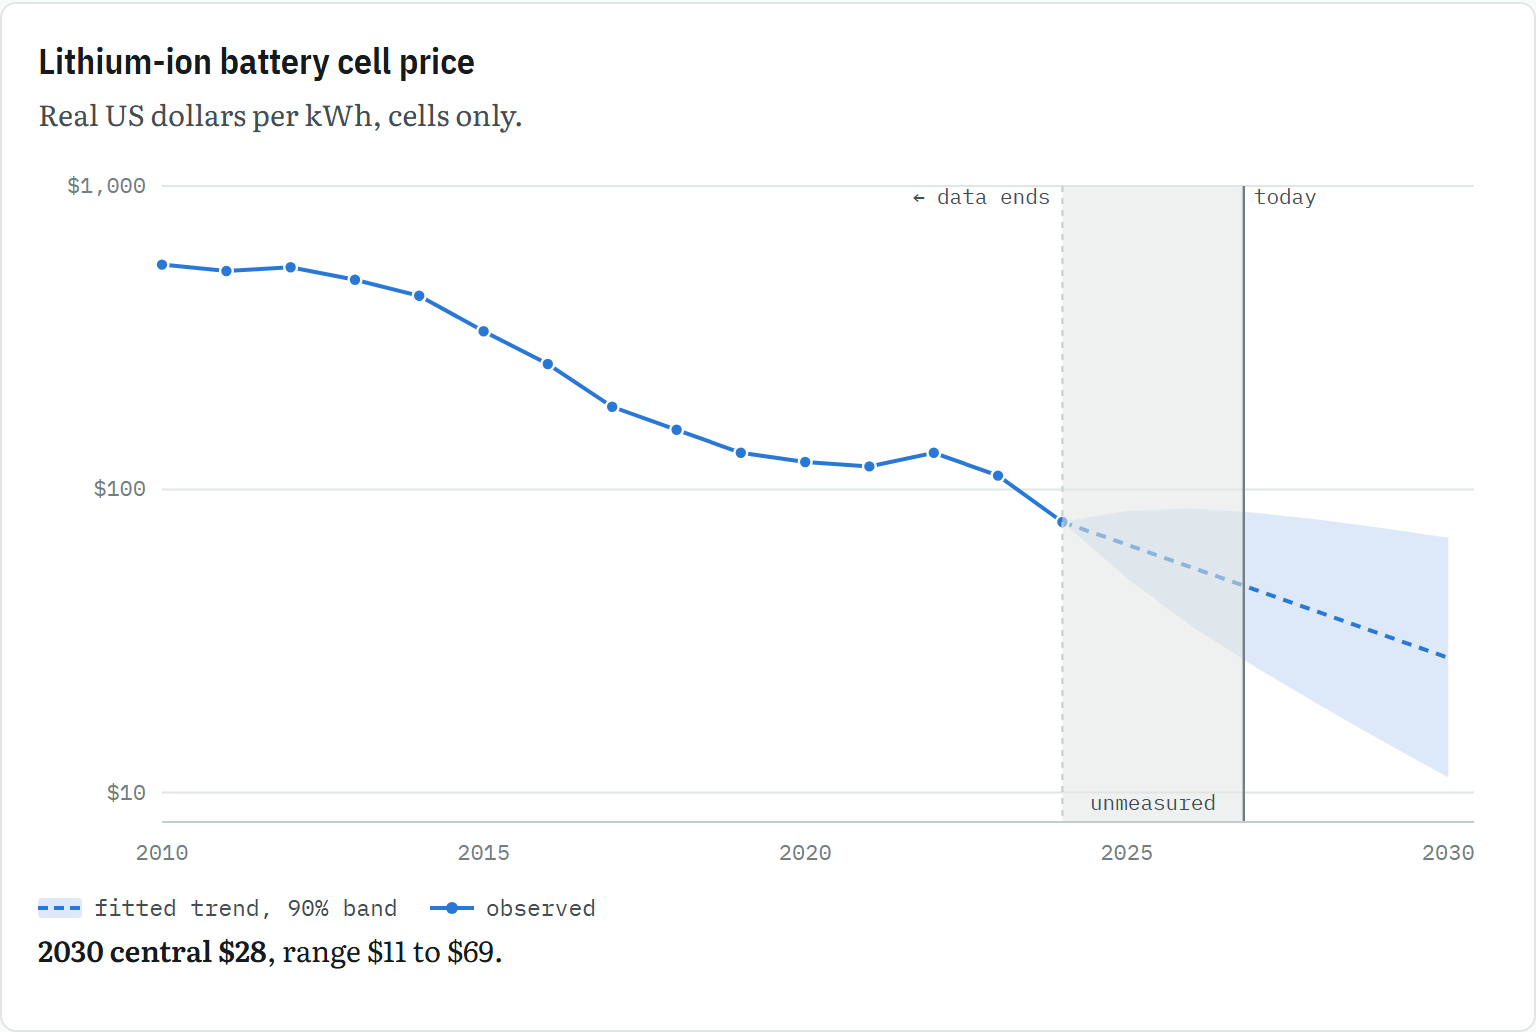
On the ground. The cells for a 60 kWh car: $552,000 at 1991 prices, $4,700 in 2024, about $1,700 on the 2030 central line.
Show the numbers
| Year | Series | Value | Range / note |
|---|---|---|---|
| 2024 | fitted trend, 90% band | $78 | $78 to $78 |
| 2025 | fitted trend, 90% band | $66 | $51 to $85 |
| 2026 | fitted trend, 90% band | $55 | $35 to $86 |
| 2027 | fitted trend, 90% band | $47 | $26 to $84 |
| 2028 | fitted trend, 90% band | $39 | $19 to $79 |
| 2029 | fitted trend, 90% band | $33 | $15 to $74 |
| 2030 | fitted trend, 90% band | $28 | $11 to $69 |
| 1991 | observed | $9,210 | |
| 1992 | observed | $7,388 | |
| 1993 | observed | $5,882 | |
| 1994 | observed | $6,714 | |
| 1995 | observed | $6,302 | |
| 1996 | observed | $5,308 | |
| 1997 | observed | $4,545 | |
| 1998 | observed | $3,657 | |
| 1999 | observed | $2,770 | |
| 2000 | observed | $2,691 | |
| 2001 | observed | $1,878 | |
| 2002 | observed | $1,346 | |
| 2003 | observed | $1,040 | |
| 2004 | observed | $931 | |
| 2005 | observed | $803 | |
| 2006 | observed | $687 | |
| 2007 | observed | $656 | |
| 2008 | observed | $688 | |
| 2009 | observed | $613 | |
| 2010 | observed | $551 | |
| 2011 | observed | $525 | |
| 2012 | observed | $540 | |
| 2013 | observed | $491 | |
| 2014 | observed | $434 | |
| 2015 | observed | $332 | |
| 2016 | observed | $259 | |
| 2017 | observed | $187 | |
| 2018 | observed | $157 | |
| 2019 | observed | $132 | |
| 2020 | observed | $123 | |
| 2021 | observed | $119 | |
| 2022 | observed | $132 | |
| 2023 | observed | $111 | |
| 2024 | observed | $78 |
Lithium-ion cells fell from $9,210 per kWh in 1991 to $78 in 2024, in today’s money, dropping 13 to 16% a year in every window I tried. The central projection is about $28 by 2030. BloombergNEF’s December 2025 survey put complete packs at $108 per kWh, down 8% in a year when metal prices rose, and packs for stationary storage at $70, down 45%.
Grid storage
That last number is why the next curve looks the way it does. Solar makes electricity cheap when the sun shines, and batteries make that matter at three in the morning. In 2025 the world added about 112 GW of grid batteries, 48% more than the year before and more than ten times as much as in 2021, according to BloombergNEF. China built more than half of it.
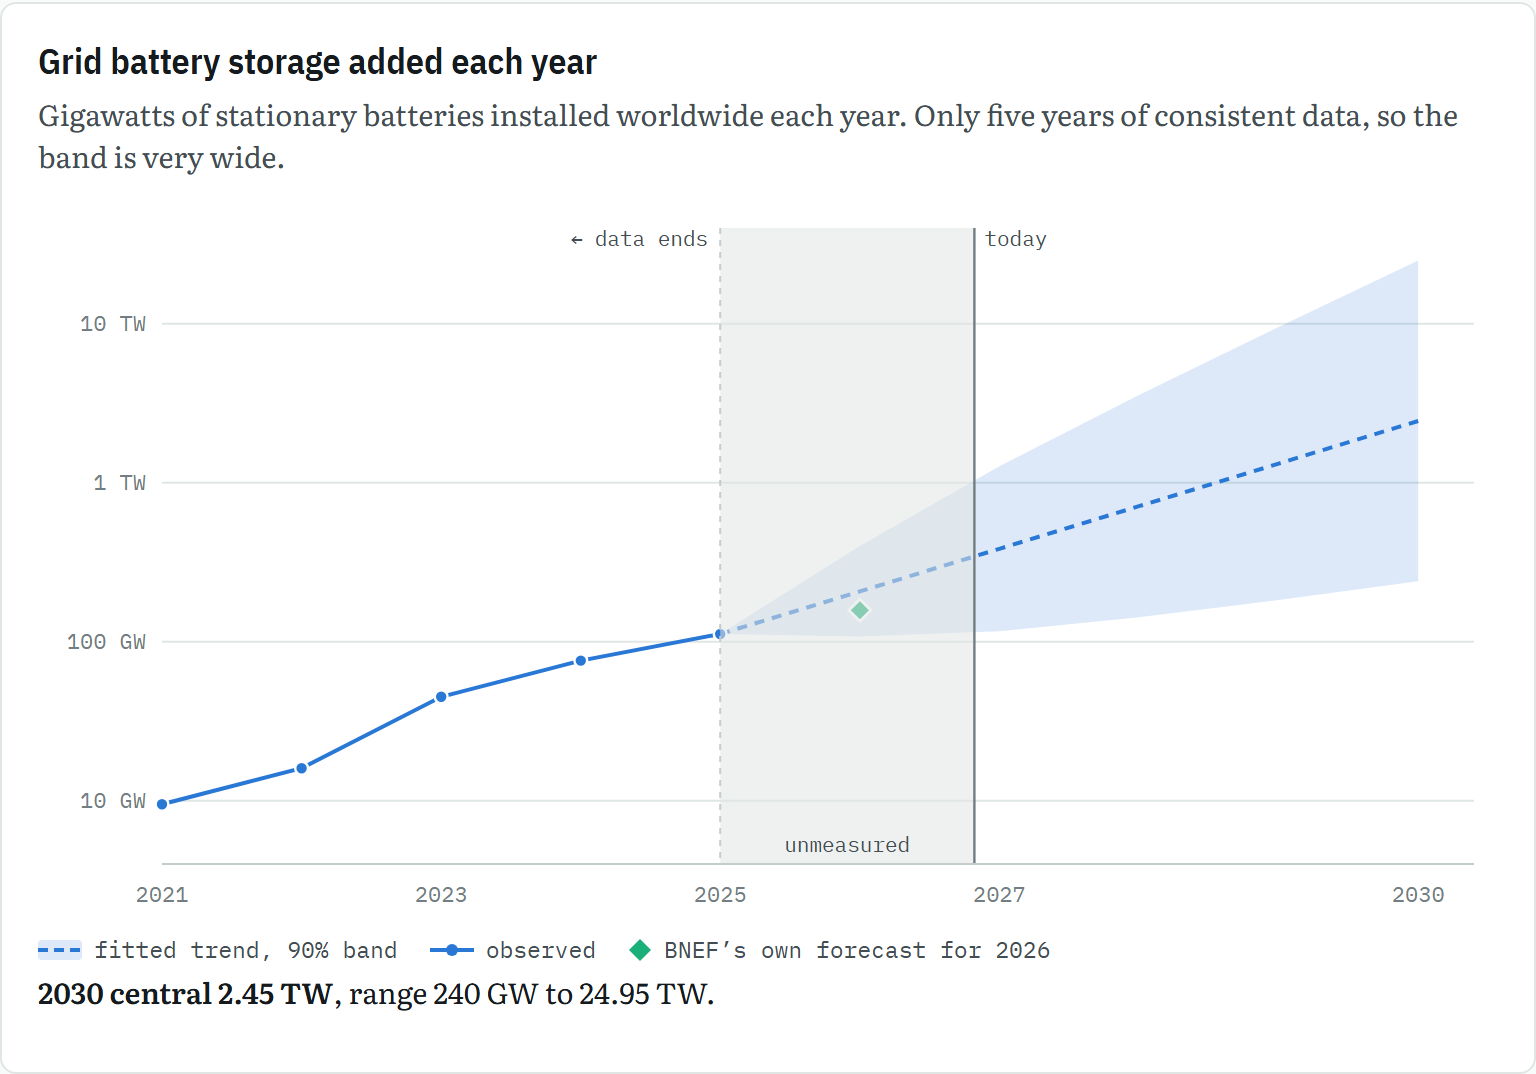
On the ground. The 307 GWh added in 2025 could hold roughly a day’s electricity for every home in Britain (rough sum).
Show the numbers
| Year | Series | Value | Range / note |
|---|---|---|---|
| 2025 | fitted trend, 90% band | 112 GW | 112 GW to 112 GW |
| 2026 | fitted trend, 90% band | 208 GW | 108 GW to 400 GW |
| 2027 | fitted trend, 90% band | 385 GW | 116 GW to 1.27 TW |
| 2028 | fitted trend, 90% band | 713 GW | 143 GW to 3.56 TW |
| 2029 | fitted trend, 90% band | 1.32 TW | 183 GW to 9.54 TW |
| 2030 | fitted trend, 90% band | 2.45 TW | 240 GW to 24.95 TW |
| 2021 | observed | 9.5 GW | |
| 2022 | observed | 16 GW | |
| 2023 | observed | 45 GW | |
| 2024 | observed | 76 GW | |
| 2025 | observed | 112 GW | |
| 2026 | BNEF’s own forecast for 2026 | 158 GW | BNEF forecast for 2026: 158 GW |
This chart is also a warning. Only five years of consistent data exist. Carried to 2030, their 85% a year has the world adding 2,400 GW of batteries a year, nearly twice every power station in the United States, with a band from 240 to 25,000 GW: the method’s polite way of saying it has no idea. A short history can’t carry a long forecast, and the fan widens to tell you so.
Where a straight line breaks
A newborn roughly triples its birth weight in the first year. If it kept that up, a 3.5 kg baby would weigh about 1.4 million tonnes on its eighteenth birthday, around a quarter of the Great Pyramid. I have met some substantial teenagers, but none on that scale. Growth charts curve over. Every exponential in biology is an S-curve whose top you can’t see yet, and the same goes for technology.
Electric cars show what happens when you forget. Their share of new car sales went from 0.7% in 2015 to 25% in 2025. Fit an exponential to that and the line passes 100% of all new cars in 2029, and then keeps going.
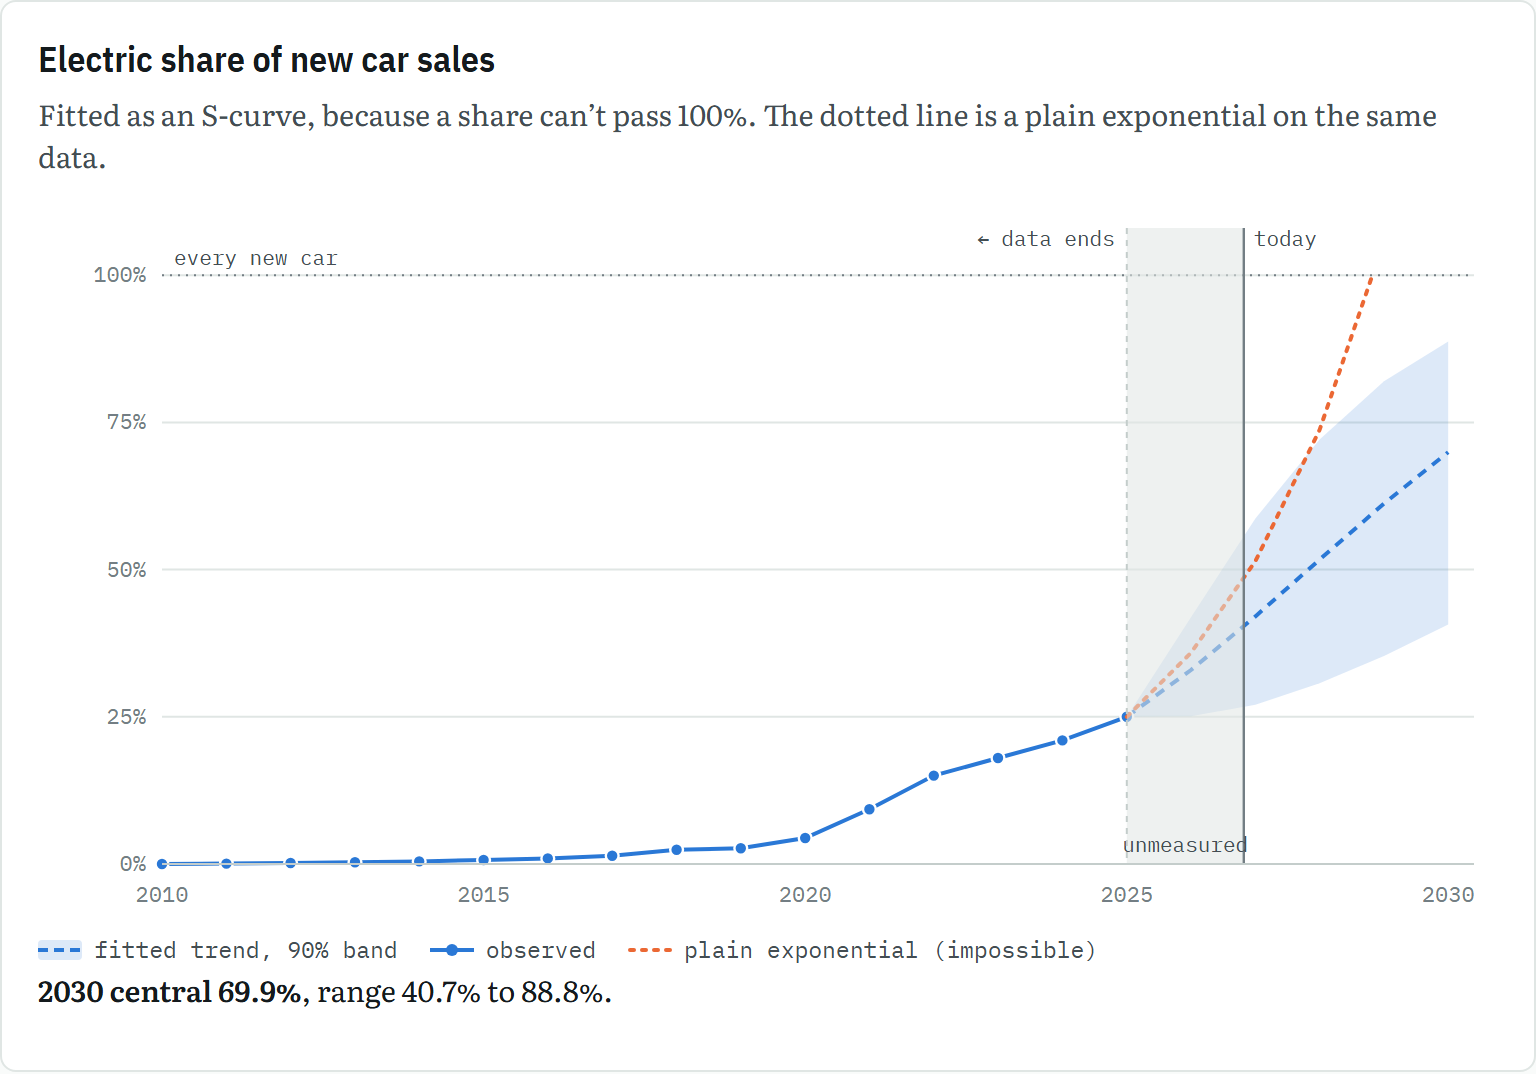
On the ground. On the central line, 7 in 10 new cars sold in 2030 are electric, but only about 1 in 6 cars on the road, because cars last fifteen years or so (rough sum).
Show the numbers
| Year | Series | Value | Range / note |
|---|---|---|---|
| 2025 | fitted trend, 90% band | 25.0% | 25.0% to 25.0% |
| 2026 | fitted trend, 90% band | 33.0% | 25.1% to 41.9% |
| 2027 | fitted trend, 90% band | 42.0% | 27.0% to 58.7% |
| 2028 | fitted trend, 90% band | 51.7% | 30.7% to 72.1% |
| 2029 | fitted trend, 90% band | 61.2% | 35.3% to 82.0% |
| 2030 | fitted trend, 90% band | 69.9% | 40.7% to 88.8% |
| 2010 | observed | 0.01% | |
| 2011 | observed | 0.07% | |
| 2012 | observed | 0.17% | |
| 2013 | observed | 0.29% | |
| 2014 | observed | 0.44% | |
| 2015 | observed | 0.68% | |
| 2016 | observed | 0.95% | |
| 2017 | observed | 1.4% | |
| 2018 | observed | 2.4% | |
| 2019 | observed | 2.7% | |
| 2020 | observed | 4.4% | |
| 2021 | observed | 9.3% | |
| 2022 | observed | 15.0% | |
| 2023 | observed | 18.0% | |
| 2024 | observed | 21.0% | |
| 2025 | observed | 25.0% | |
| 2025 | plain exponential (impossible) | 25.0% | 2025: 25% (plain exponential) |
| 2026 | plain exponential (impossible) | 35.8% | 2026: 36% (plain exponential) |
| 2027 | plain exponential (impossible) | 51.4% | 2027: 51% (plain exponential) |
| 2028 | plain exponential (impossible) | 73.7% | 2028: 74% (plain exponential) |
| 2028.8 | plain exponential (impossible) | 100.0% | 2029: 100% (plain exponential) |
Fitted as an S-curve, the central projection is 70% of new cars electric by 2030, with a band from 41% to 89%. Even that is probably high. The same S-curve fitted on data to 2019 predicted 51% for 2025, against an actual 25%. The curve bent sooner than its own history said it would.
Every exponential is an S-curve whose top you haven’t seen yet. The useful question is where the ceiling is, and how many doublings away.
For electric cars the ceiling is about two doublings away. For solar, at about 9% of electricity, it is several. For AI compute, Epoch puts it in gigawatts and chip-packaging plants.
The bottom of the next S
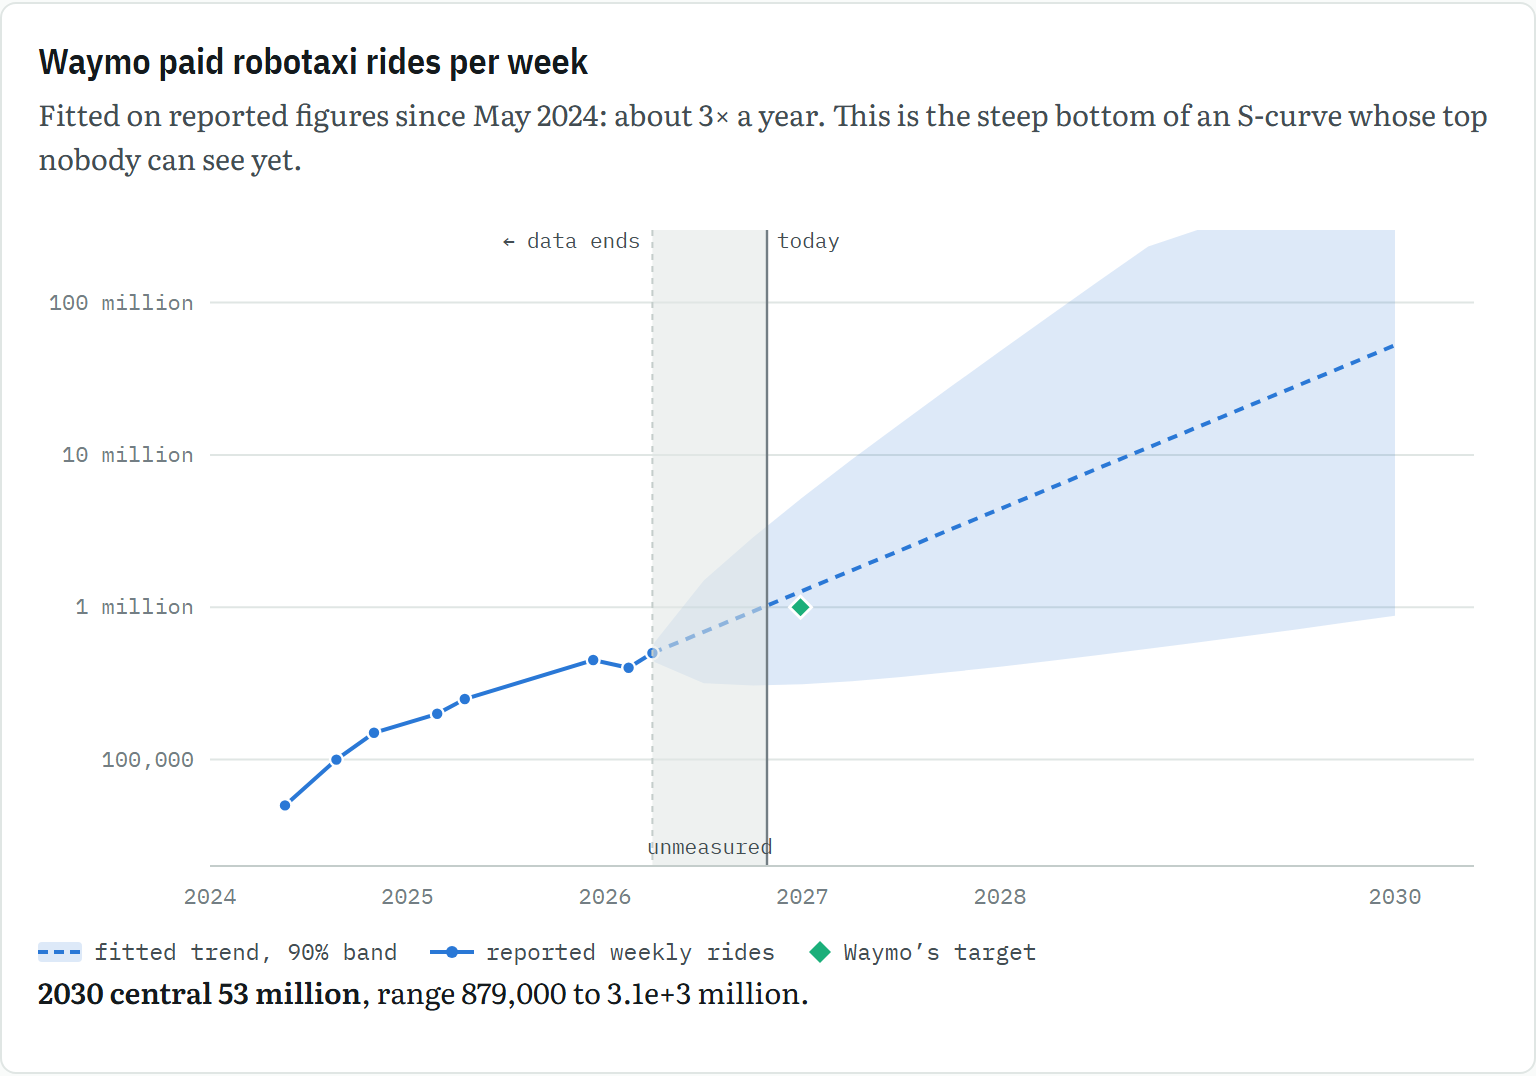
On the ground. Half a million rides a week from about 3,000 cars is around 24 paid rides per car per day (rough sum).
Show the numbers
| Year | Series | Value | Range / note |
|---|---|---|---|
| 2026.2 | fitted trend, 90% band | 500,000 | 500,000 to 500,000 |
| 2026.3 | fitted trend, 90% band | 506,000 | 437,000 to 586,000 |
| 2026.5 | fitted trend, 90% band | 690,000 | 317,000 to 1.5 million |
| 2026.8 | fitted trend, 90% band | 940,000 | 306,000 to 2.9 million |
| 2027 | fitted trend, 90% band | 1.3 million | 312,000 to 5.3 million |
| 2027.3 | fitted trend, 90% band | 1.7 million | 327,000 to 9.3 million |
| 2027.5 | fitted trend, 90% band | 2.4 million | 349,000 to 16 million |
| 2027.8 | fitted trend, 90% band | 3.2 million | 375,000 to 28 million |
| 2028 | fitted trend, 90% band | 4.4 million | 407,000 to 48 million |
| 2028.3 | fitted trend, 90% band | 6 million | 444,000 to 82 million |
| 2028.5 | fitted trend, 90% band | 8.2 million | 486,000 to 1.4e+2 million |
| 2028.8 | fitted trend, 90% band | 11 million | 533,000 to 2.3e+2 million |
| 2029 | fitted trend, 90% band | 15 million | 587,000 to 4.0e+2 million |
| 2029.3 | fitted trend, 90% band | 21 million | 648,000 to 6.7e+2 million |
| 2029.5 | fitted trend, 90% band | 28 million | 716,000 to 1.1e+3 million |
| 2029.8 | fitted trend, 90% band | 39 million | 793,000 to 1.9e+3 million |
| 2030 | fitted trend, 90% band | 53 million | 879,000 to 3.1e+3 million |
| 2024.4 | reported weekly rides | 50,000 | May 2024: ~50,000 |
| 2024.6 | reported weekly rides | 100,000 | Aug 2024: 100,000 |
| 2024.8 | reported weekly rides | 150,000 | Oct 2024: 150,000 |
| 2025.2 | reported weekly rides | 200,000 | Feb 2025: 200,000 |
| 2025.3 | reported weekly rides | 250,000 | Apr 2025: 250,000 |
| 2025.9 | reported weekly rides | 450,000 | Dec 2025: ~450,000 (investor letter) |
| 2026.1 | reported weekly rides | 400,000 | Feb 2026: ~400,000 |
| 2026.2 | reported weekly rides | 500,000 | Mar 2026: 500,000 |
| 2027.0 | Waymo’s target | 1 million | Waymo target: 1 million a week by end-2026 |
Robotaxis are where electric cars were a decade ago: tiny, and multiplying. Waymo gave about 50,000 paid rides a week in May 2024 and 500,000 by March 2026, roughly tripling each year. On trend that is about a million a week by now, which happens to be Waymo’s own target for the end of 2026. Waymo hasn’t published a figure since March, so the shaded strip on this chart is doing a lot of work. The central line reaches about 50 million a week by 2030, but the top of the fan is three billion, which would mean everyone on Earth taking a robotaxi every three weeks. That absurdity is the method being honest: a few years of data from the steep bottom of an S-curve can’t see where the top is. The top will be set by cities, regulators and insurers rather than by engineers.
Humanoid robots are a step further back. About 19,000 shipped worldwide in the first half of 2026, nearly four times as many as a year earlier, almost all from Chinese makers. That is too few points to fit a curve. It is more than the 13,640 cars Ferrari built in the whole of 2025. Meanwhile the ordinary industrial robot, the arm that welds car doors, has sold about half a million a year for four years running. Not every robot is on an exponential. Most of them are bolted to the floor.
The curve that’s speeding up
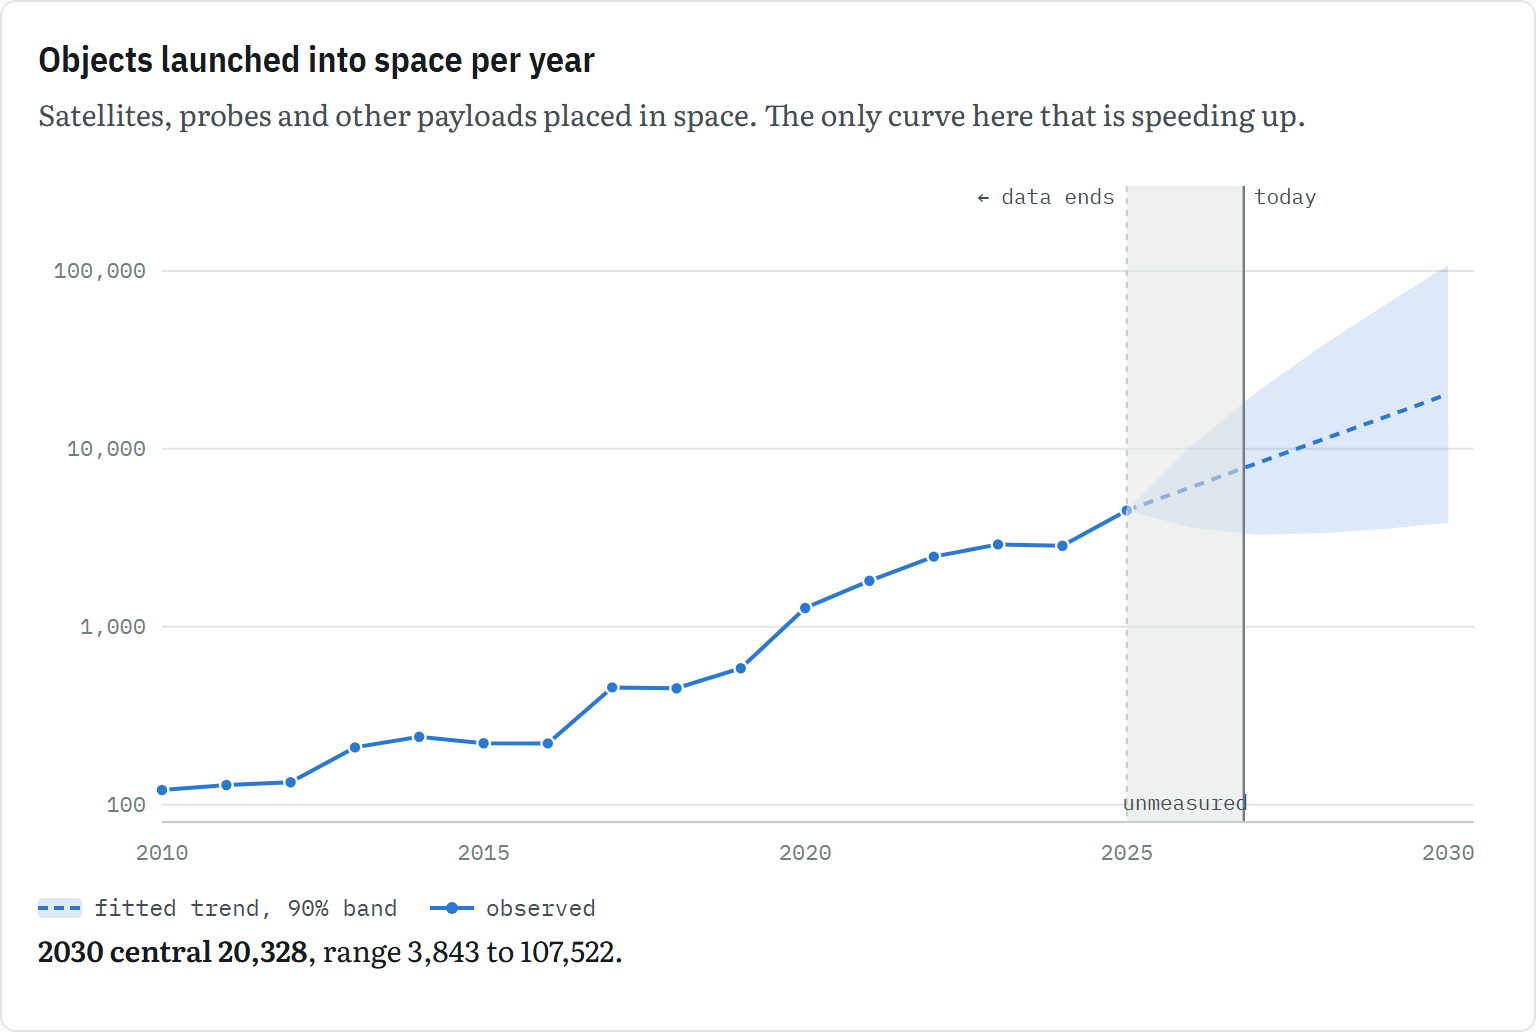
On the ground. One object every three days in 2000. On the 2030 central line, one every 26 minutes.
Show the numbers
| Year | Series | Value | Range / note |
|---|---|---|---|
| 2025 | fitted trend, 90% band | 4,510 | 4,510 to 4,510 |
| 2026 | fitted trend, 90% band | 6,095 | 3,612 to 10,285 |
| 2027 | fitted trend, 90% band | 8,236 | 3,296 to 20,585 |
| 2028 | fitted trend, 90% band | 11,131 | 3,347 to 37,021 |
| 2029 | fitted trend, 90% band | 15,042 | 3,544 to 63,838 |
| 2030 | fitted trend, 90% band | 20,328 | 3,843 to 107,522 |
| 2000 | observed | 121 | |
| 2001 | observed | 86 | |
| 2002 | observed | 96 | |
| 2003 | observed | 88 | |
| 2004 | observed | 74 | |
| 2005 | observed | 72 | |
| 2006 | observed | 95 | |
| 2007 | observed | 111 | |
| 2008 | observed | 109 | |
| 2009 | observed | 125 | |
| 2010 | observed | 121 | |
| 2011 | observed | 129 | |
| 2012 | observed | 134 | |
| 2013 | observed | 210 | |
| 2014 | observed | 241 | |
| 2015 | observed | 222 | |
| 2016 | observed | 221 | |
| 2017 | observed | 456 | |
| 2018 | observed | 452 | |
| 2019 | observed | 586 | |
| 2020 | observed | 1,274 | |
| 2021 | observed | 1,814 | |
| 2022 | observed | 2,479 | |
| 2023 | observed | 2,903 | |
| 2024 | observed | 2,849 | |
| 2025 | observed | 4,510 |
In 2000, 121 objects were launched into space, one every three days. In 2025 there were 4,510. This is the only curve here whose growth rate is rising: 15.6% a year fitted from 2000, 27.3% from 2010 and 35.1% from 2015. Reusable rockets cut the cost of each launch, and satellite constellations created a reason to launch thousands of objects. Starlink alone has gone from one million subscribers at the end of 2022 to about twelve million by mid-2026. The backtest underestimated this curve threefold. Its 2030 band, 3,800 to 108,000 objects a year, is the widest in the essay, because the curve keeps changing gear. The central line has something going up every 26 minutes.
The curve we stopped measuring
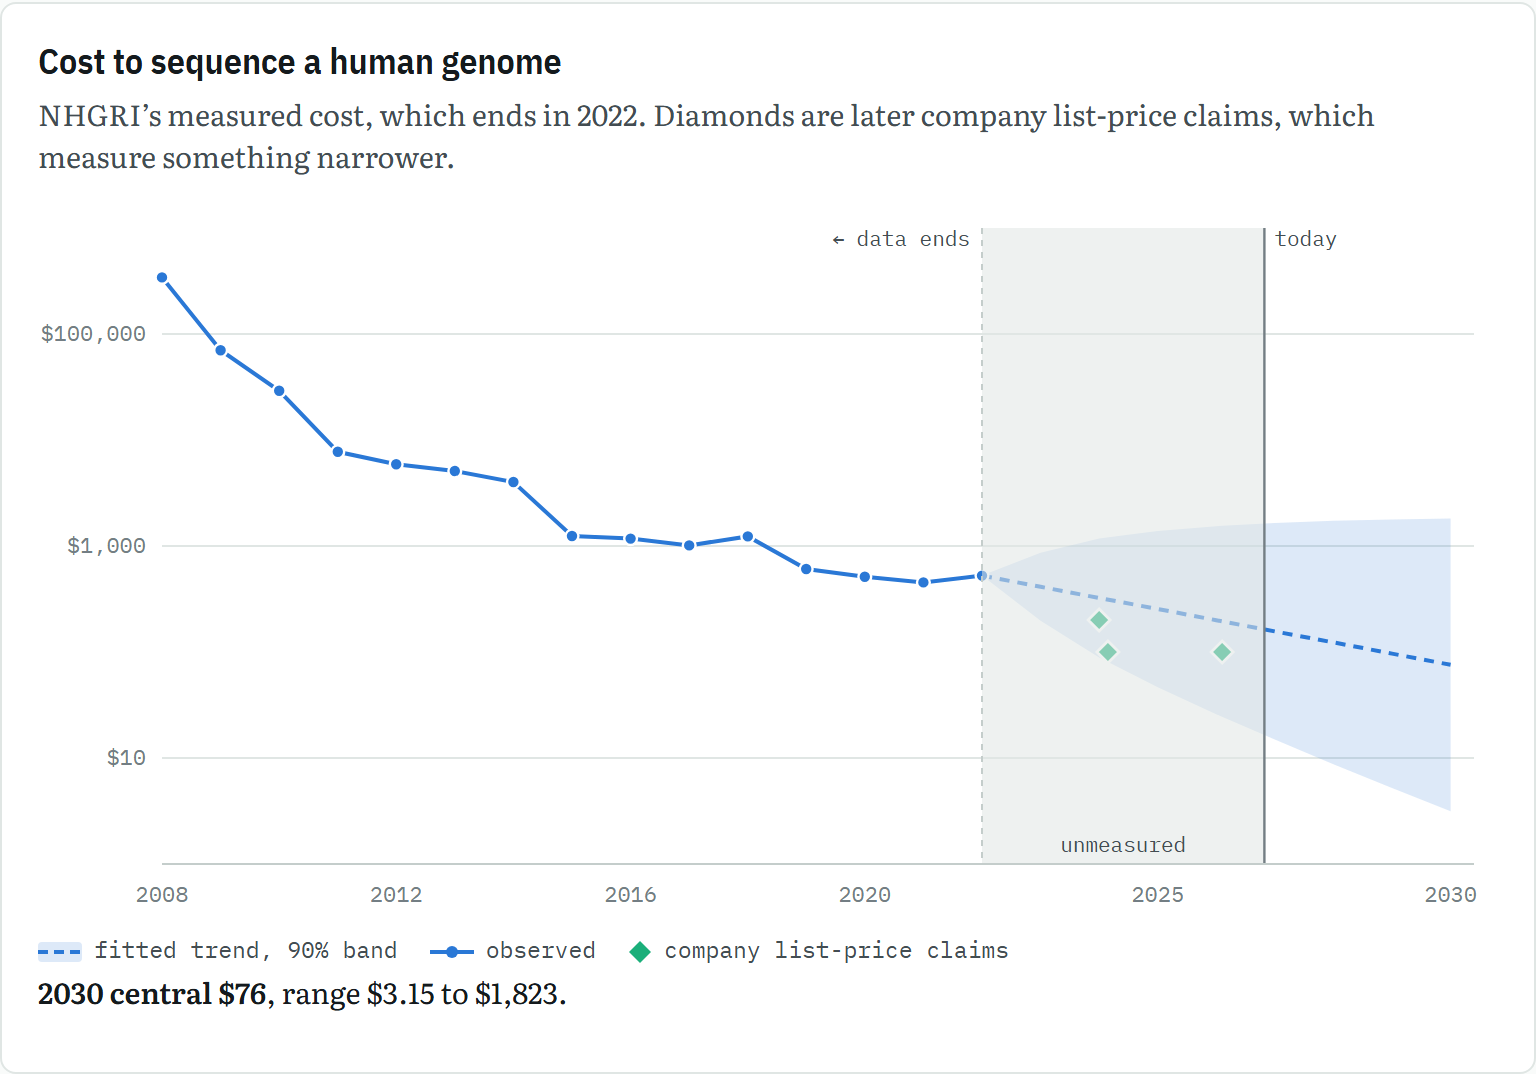
On the ground. One genome cost about $95 million in 2001 and $525 in 2022, roughly the price of a decent pram.
Show the numbers
| Year | Series | Value | Range / note |
|---|---|---|---|
| 2022 | fitted trend, 90% band | $525 | $525 to $525 |
| 2023 | fitted trend, 90% band | $412 | $197 to $863 |
| 2024 | fitted trend, 90% band | $324 | $89 to $1,180 |
| 2025 | fitted trend, 90% band | $254 | $47 to $1,387 |
| 2026 | fitted trend, 90% band | $199 | $26 to $1,537 |
| 2027 | fitted trend, 90% band | $157 | $15 to $1,647 |
| 2028 | fitted trend, 90% band | $123 | $8.75 to $1,727 |
| 2029 | fitted trend, 90% band | $97 | $5.22 to $1,784 |
| 2030 | fitted trend, 90% band | $76 | $3.15 to $1,823 |
| 2001 | observed | $95.3M | |
| 2002 | observed | $61.4M | |
| 2003 | observed | $40.2M | |
| 2004 | observed | $18.5M | |
| 2005 | observed | $13.8M | |
| 2006 | observed | $10.5M | |
| 2007 | observed | $7.15M | |
| 2008 | observed | $342,502 | |
| 2009 | observed | $70,333 | |
| 2010 | observed | $29,092 | |
| 2011 | observed | $7,743 | |
| 2012 | observed | $5,901 | |
| 2013 | observed | $5,096 | |
| 2014 | observed | $4,008 | |
| 2015 | observed | $1,245 | |
| 2016 | observed | $1,176 | |
| 2017 | observed | $1,015 | |
| 2018 | observed | $1,232 | |
| 2019 | observed | $606 | |
| 2020 | observed | $512 | |
| 2021 | observed | $454 | |
| 2022 | observed | $525 | |
| 2024 | company list-price claims | $200 | Illumina, 2024: “as little as $200” |
| 2024.2 | company list-price claims | $100 | Ultima UG100 launch, 2024: $100 target |
| 2026.1 | company list-price claims | $100 | Element VITARI launch, Feb 2026: $100 |
From 2001 to 2015, the cost of reading a human genome fell from $95 million to $1,245, according to the US National Human Genome Research Institute. That is 55% a year for fourteen years, halving about every ten months, while Moore’s Law was doubling every two years. Then it slowed, to 4.7% a year from 2019, with costs of $606, $512, $454 and $525. NHGRI stopped updating the series after 2022.
The companies say the fall carried on, to list prices of $80 to $200, but those measure something narrower than NHGRI’s cost: Front Line Genomics points out that the labour, storage and analysis don’t get cheaper at the same rate.
This is the one curve that comes back to my day job. In England, the NHS and Genomics England’s Generation Study has been reading the whole genomes of newborn babies since 2024, looking for about 200 rare conditions that can be treated if caught early. It aims for 100,000 babies and had passed 75,000 by the summer of 2026. When I started my doctorate in 2004, reading one genome cost about $18 million. A newborn genome is now cheap enough to be a reasonable thing to offer a baby on its first week out, and the hard questions have moved from cost to consent.
Put this beside METR’s sixteen-hour limit and a pattern appears. The curves can outrun the instruments that measure them.
See you next October
Most forecasts are never checked. This one will be. For each curve, the table gives the band for the figure that will have been published by October 2027, which for most of them means the 2026 number. A 90% band should miss about one time in ten, so of the ten curves that can still be checked, roughly one should land outside its band. If three or more do, the method is wrong, and I’ll come back here next October, update every chart and say so. METR and NHGRI no longer publish their series and the AI price chart isn’t projected, so those three sit this one out.
| Curve | Rate | Check in Oct 2027 | 2030 central | 2030 band |
|---|---|---|---|---|
| AI task length | doubles every 178 days¹ | no longer measured | 3,000 h | 43–210,000 h |
| AI at a fixed level | cliff, then floor | today’s best at 1/61–1/654 of today’s price² | — | — |
| Frontier training compute | 4.0× a year¹ | record run: 9×10²⁶–3×10²⁸ | 1×10²⁹ | 3×10²⁷–3×10³⁰ |
| Frontier training power | 2.3× a year¹ | record run: 233–5,186 MW | 3.8 GW | 0.2–232 GW |
| Transistors per chip | +38% a year | 2027 record: 422B–510B | 1.2T | 937B–1.6T |
| Solar module price | −16.6% a year | 2026: $0.07–$0.15/W | $0.049/W | $0.013–$0.19 |
| Solar capacity | +26.6% a year | 2026: 2,808–3,279 GW | 7.8 TW | 6.1–10.0 TW |
| Battery cell price | −15.8% a year | 2026: $35–$86/kWh | $28/kWh | $11–$69 |
| Grid storage added per year | +85% a year³ | 2026: 108–400 GW | 2,447 GW | 240–24,946 GW |
| Electric share of car sales | S-curve | 2026: 25–42% | 70% | 41–89% |
| Waymo rides per week | 3.4× a year¹ | Oct 2027: 0.4M–28.0M | 53M | 1M–3.1B |
| Objects launched per year | +35% a year | 2026: 3,600–10,300 | 20,300 | 3,800–108,000 |
| Genome sequencing cost | −21.5% a year | no longer measured | $76 | $3–$1,823 |
All ranges are 90% bands: about one in ten should miss. ¹ Measured at irregular dates, so fitted as a random walk on those dates. ² Not a 90% band: the range seen so far one year after a new level appeared. ³ Five years of data, so treat the band as a shrug. Everything else uses the last ten years of data.
So what follows
Computing and energy are one system. The curves that survived fall into two families: computation, and electrotech. They feed each other. The power drawn by the biggest AI training runs more than doubles every year, and the grid it draws from is increasingly built from solar and batteries. So, a year on, how does “To Boldly Grow” look? The prices are as good as I claimed: solar modules and battery cells have fallen steadily for decades and show no sign of stopping. Deployment is the weak link. Solar capacity, electric cars and the backtest all say the same thing: the things we install bend sooner than the things we make cheaper. I was right about the direction and too cheerful about the speed.
Ceilings decide the outcome. Electric cars are about two doublings from theirs, and solar is several away. Robotaxis haven’t seen theirs. The AI benchmark’s ceiling, for now, is the length of the ruler. Whether something is exponential matters less than where it stops.
The phrase overstates, and the reality is still remarkable. Turbine alloys, steel and electric motors improved steadily but never exponentially. Progress is lumpy, specific and sometimes temporary. The curves that are running, though, run at rates that are hard to take in.
Every new parent in Britain is handed a little red book with growth charts in the back. The charts don’t show a line. They show a fan of centile bands, and nobody expects a baby to follow the middle one. Health visitors aren’t worried by a baby that wanders about inside its band. They are worried by one that crosses two lines. That is roughly how to read the next five years. Find out which curve you’re on, watch the band rather than the line, and notice when something crosses two.
Next: Will You Live in Exponential Times? This essay asked which curves are really exponential. The next asks what living on them will be like: the slow curves that matter more than the fast ones, the jumps no trend line can see coming, the brakes, from grid queues to planning rules, that decide how fast any of it reaches your street, and the one number nobody can fit a curve to: the chance that it all goes badly wrong.
Method. Fitted bands are 90% prediction intervals from a random walk with drift and correlated noise (θ = 0.63), following Farmer and Lafond (2016). The average change and its spread are estimated from year-on-year changes in log values, or in logistic values for the electric-car share, over each series’ last ten years of data (the last eight observations for transistors). The backtest refits the same way on the ten years to 2019; 29 of 32 later values fell inside its bands. AI task length, frontier training compute and power, and Waymo rides are measured at irregular dates, so they are fitted as a random walk with drift on the actual dates (each gap’s change scaled by its length), with the same correlated-noise allowance as the annual fits. For record series, the lower band is held at the current record, since a record can’t fall. AI price is shown as data only: for each of three GPQA Diamond accuracy levels (first reached by GPT-4, o1 and o3), the cheapest cost per question as running records by model release date, divided by the launch cost, derived from the data behind Epoch’s “The plunging price of thought”. Grid storage has only five consistent years (BNEF, 2021–2025; 2021 derived from BNEF’s growth rate), so its band is very wide. Growth rates quoted “from 2000” or “from 2010” come from refitting on that window.
Caveats. Trend extrapolation knows nothing about physical limits, supply chains, policy or saturation, which is why the electric-car chart is fitted as an S-curve. Solar prices are in real dollars as published by Our World in Data, which revises its inflation base and recent values. Battery prices are for cells, not packs. Launches count objects placed in space, not rockets. The genome series ends in 2022 because NHGRI stopped publishing it, and later company prices are claims rather than a comparable series.
Sources. METR via Wikipedia. Epoch AI on inference prices and “The plunging price of thought”. BloombergNEF on grid storage. Waymo ridership via TechCrunch and Alphabet. Humanoid shipments: Smart Analytics Global via Bloomberg; IFR World Robotics 2026. Our World in Data: solar module price and installed capacity (IRENA), lithium-ion cell price, electric-car sales share (IEA), objects launched (UN OOSA) and genome sequencing cost (NHGRI). Epoch AI Trends, updated February 2026, and Can AI scaling continue through 2030?. METR’s time-horizon paper and tracker. Wikipedia: Transistor count. BloombergNEF 2025 battery price survey. Ember Global Electricity Review 2026. Front Line Genomics. Way et al. (2022).